| Columns Retired Columns & Blogs |
Mytek HiFi Brooklyn D/A processor–headphone amplifier Measurements
Sidebar 3: Measurements
Footnote 1: My thanks to Jürgen Reis of MBL for suggesting this test to me.
I measured the Mytek Brooklyn with my newly recalibrated Audio Precision SYS2722 system (see the January 2008 As We See It"). As well as the Audio Precision's analog and digital outputs, I used WAV and AIFF test-tone files sourced via USB from my MacBook Pro running on battery power with Pure Music 3.0. I updated the firmware to v.2.2.1 before the testing, using the Brooklyn Control app running on my laptop. Apple's USB Prober utility identified the Brooklyn as "Brooklyn DAC" from "Mytek Digital," its serial number as "03105-1605-101," and confirmed that the USB interface supported audio recording as well as playback. The Brooklyn's USB port operated in the optimal isochronous asynchronous mode, and Apple's AudioMIDI utility revealed that it accepted 32-bit integer data via USB sampled at all rates from 44.1 to 384kHz.
Looking first at the behavior of the Brooklyn with digital input signals, I bypassed the volume control with the front-panel menu and controls so I could examine the intrinsic behavior of the digital circuitry. The maximum output levels at 1kHz were 9.84V from the balanced outputs and 4.9V from the single-ended outputs. The volume control remains active for the headphone output, and the maximum output level was 9.77V. However, a slight degree of waveform clipping was visible on the oscilloscope at this level; backing off the volume by 1dB eliminated this. In practice, of course, the headphone output will never be operated near this level. The output impedance was 149 ohms from the balanced XLR jacks, 74.5 ohms from the unbalanced RCA jacks, and an appropriately low 1 ohm from the headphone jacks. The balanced and single-ended outputs preserved absolute polarity, but one of the headphone outputs inverted polarity when the Brooklyn was set to Phase Pos.
The impulse response with 44.1kHz PCM data varied according to the reconstruction filter in use. (To select these filters, MQA playback must be disabled; for MQA, the filter is set to a fixed, minimum-phase, slow-rolloff type.) With the Slow Rolloff (SR) filter, the impulse response was time-symmetrical but extremely short (fig.1). The Fast Rolloff (FR) impulse response (fig.2) was typical of a DAC using a conventional finite impulse-response (FIR) reconstruction filter, with the symmetrical ringing to either side of the pulse mapping the filter's coefficient values. With the Minimum Phase (MPh) filter, all ringing occurred after the single full-scale sample, as expected (fig.3).
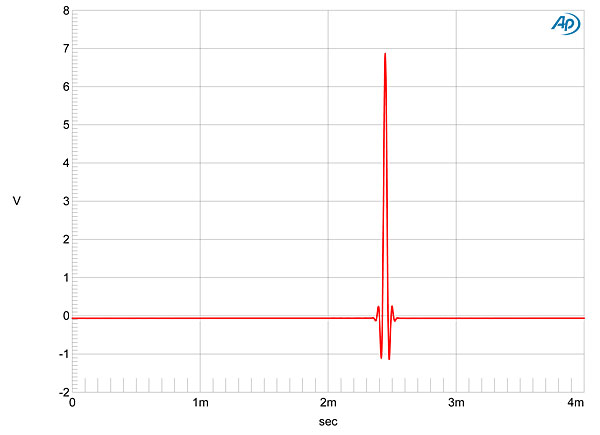
Fig.1 Mytek Brooklyn, digital input, SR filter, impulse response (one sample at 0dBFS, 44.1kHz sampling, 4ms time window).
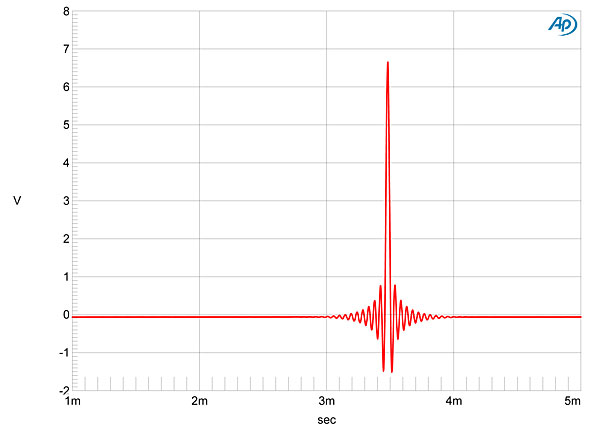
Fig.2 Mytek Brooklyn, digital input, FR filter, impulse response (one sample at 0dBFS, 44.1kHz sampling, 4ms time window).
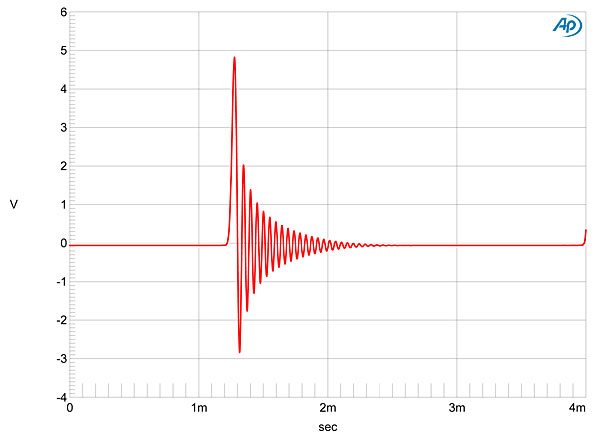
Fig.3 Mytek Brooklyn, digital input, MPh filter, impulse response (one sample at 0dBFS, 44.1kHz sampling, 4ms time window).
The SR filter's slow rolloff above the baseband is shown by the red and magenta traces in fig.4, with the aliased image at 25kHz of a full-scale tone at 19.1Hz (cyan, blue traces) suppressed by just 10dB (footnote 1). Other images can be seen in the audioband and above, though the harmonics of the tone lie at –76dB (0.03%) and below. The FR and MPh filters both offer a very steep rolloff above the audioband (fig.5, magenta and red traces), though the distortion harmonics of the 19.1kHz tone (cyan, blue) are slightly higher than in fig.4. With the Brooklyn set to MQA decoding (fig.6), the rolloff is shallower than with SR, with a null at 44.1kHz (footnote 2). Many more aliasing products of the 19.1kHz tone are now evident (cyan, blue traces).
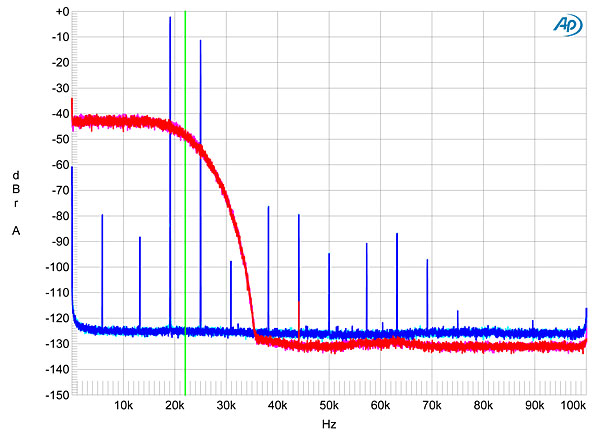
Fig.4 Mytek Brooklyn, digital input, SR filter, wideband spectrum of white noise at –4dBFS (left channel red, right magenta) and 19.1kHz tone at 0dBFS (left blue, right cyan), with data sampled at 44.1kHz (20dB/vertical div.).
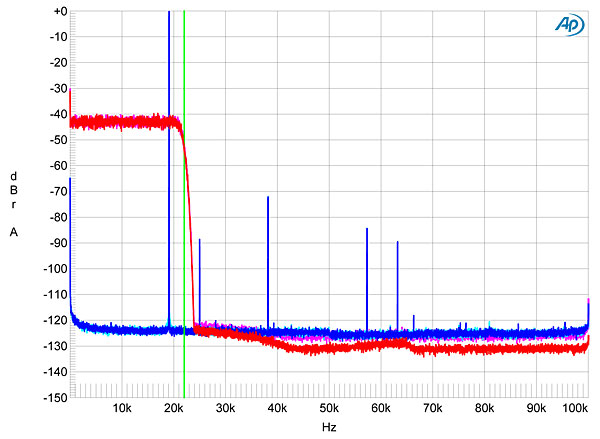
Fig.5 Mytek Brooklyn, digital input, FR filter, wideband spectrum of white noise at –4dBFS (left channel red, right magenta) and 19.1kHz tone at 0dBFS (left blue, right cyan), with data sampled at 44.1kHz (20dB/vertical div.).
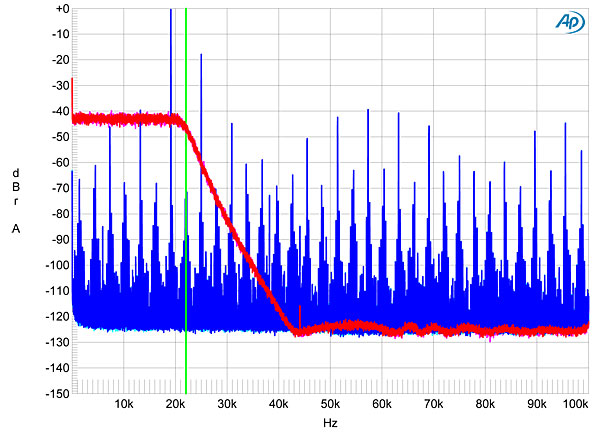
Fig.6 Mytek Brooklyn, digital input, MQA filter, wideband spectrum of white noise at –4dBFS (left channel red, right magenta) and 19.1kHz tone at 0dBFS (left blue, right cyan), with data sampled at 44.1kHz (20dB/vertical div.).
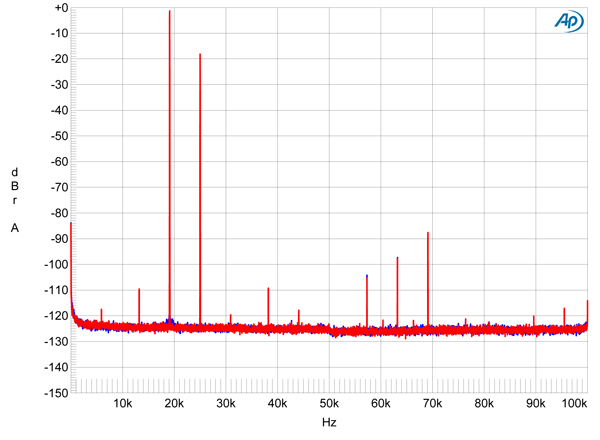
Fig.6A Mytek Brooklyn, digital input, MQA filter, wideband spectrum of 19.1kHz tone at –1dBFS (left blue, right red), with data sampled at 44.1kHz (20dB/vertical div.).
Following publication of this review, I reexamined the behavior of the Brooklyn's MQA reconstruction filter at lower signal levels. The spectrum with a 19.1kHz tone at –0.1dBFS, –0.4dBFS, and –0.7dBFS was identical to that at 0dBFS (fig.6, blue and cyan traces) but with data at –1dBFS, the spectrum looked dramatically cleaner (fig.6A). This suggests that the MQA filter overloads with high-frequency signals that approach 0dBFS. As Bob Stuart has discussed, real musical spectra does not have full-scale content at the top of the audio band, meaning that the filter's resolution can be optimized for low-level signals. It is still "leaky" regarding its rejection of ultrasonic images of the baseband data—the image at 25kHz of the 19.1kHz tone is suppressed by just 17dB—but the spectrum is otherwise very clean compared with fig.6.
Fig.7 is a more conventional means of displaying frequency response, this time with data sampled at 44.1, 96, 192, and 384kHz and with the MPh filter engaged. (The FR filter behaved identically.) Note the superb channel matching, and that, at the three lower sample rates, the smooth rolloff above the audioband is broken by a sharp drop in output just below each Nyquist frequency (ie, half the sample rate). Fig.8 shows the response at the three lower sample rates with the SR filter; with 44.1kHz data, the Brooklyn's output is down by almost 3dB at the top of the audioband.
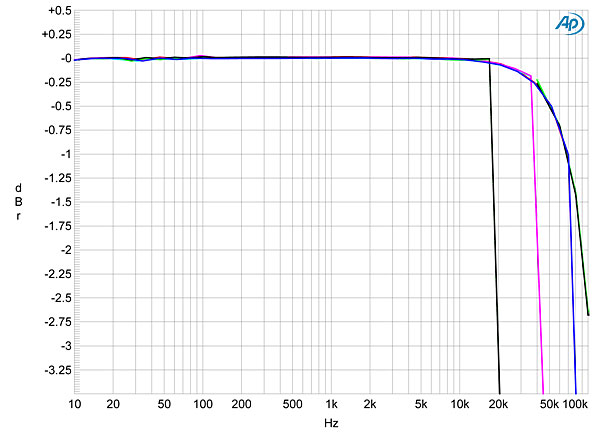
Fig.7 Mytek Brooklyn, digital input, MPh filter, frequency response at –12dBFS into 100k ohms with data sampled at: 44.1kHz (left channel green, right gray), 96kHz (left cyan, right magenta), 192kHz (left blue, right red), 384kHz (left green, right gray) (0.5dB/vertical div.).
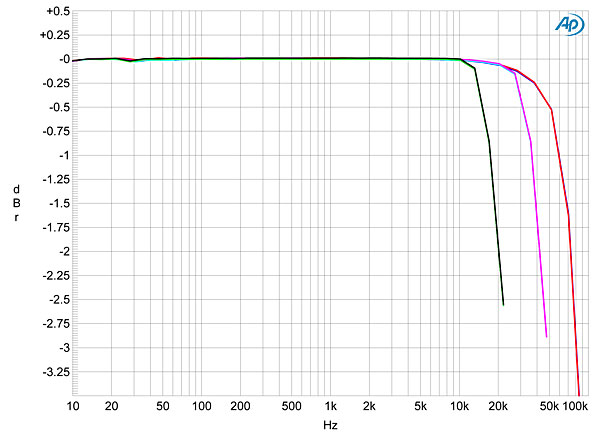
Fig.8 Mytek Brooklyn, digital input, SR filter, frequency response at –12dBFS into 100k ohms with data sampled at: 44.1kHz (left channel green, right gray), 96kHz (left cyan, right magenta), 192kHz (left blue, right red) (0.5dB/vertical div.).
The Mytek DAC offered a very low level of self noise, with no AC-supply components present (fig.9). Channel separation for the digital inputs was excellent, at close to 115dB in both directions at 1kHz and still almost 95dB at 20kHz. With data representing a dithered 1kHz tone at –90dBFS, increasing the bit depth from 16 to 24 dropped the noise floor by 20dB (fig.10), which suggests resolution between 19 and 20 bits. An undithered tone at exactly –90.31dBFS was reproduced with a superbly symmetrical waveform, with the three DC voltage levels well defined (fig.11). With undithered 24-bit data at this low level, the Brooklyn output a well-formed sinewave (fig.12).
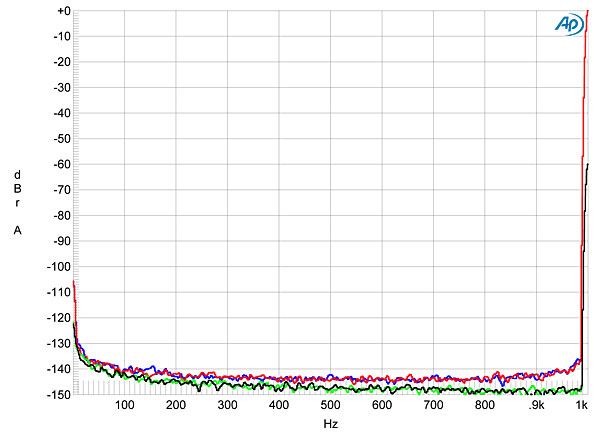
Fig.9 Mytek Brooklyn, digital input, spectrum with noise and spuriae 1kHz tone at –0dBFS (left channel blue, right red) and –60dBFS (left green, right gray) (20dB/vertical div.).
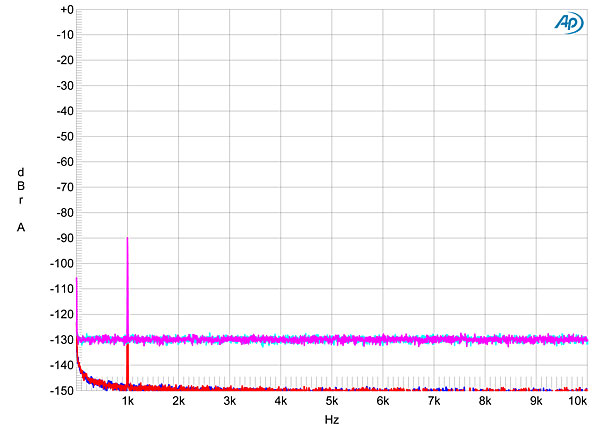
Fig.10 Mytek Brooklyn, digital input, spectrum with noise and spuriae of dithered 1kHz tone at –90dBFS with: 16-bit data (left channel cyan, right magenta), 24-bit data (left blue, right red) (20dB/vertical div.).
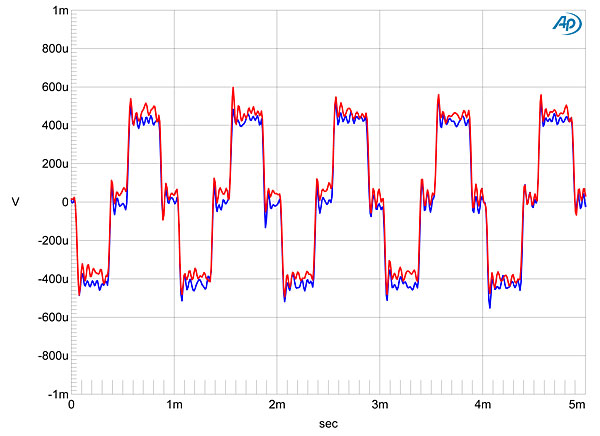
Fig.11 Mytek Brooklyn, digital input, waveform of undithered 1kHz sinewave at –90.31dBFS, 16-bit data (left channel blue, right red).
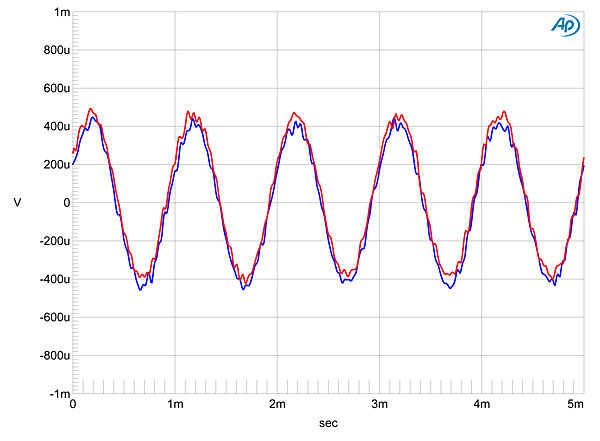
Fig.12 Mytek Brooklyn, digital input, waveform of undithered 1kHz sinewave at –90.31dBFS, 24-bit data (left channel blue, right red).
Harmonic distortion was very low, even at full scale (fig.13), with the third harmonic the highest in level at –104dB (0.0006%), dropping to –130dB when the signal was reduced by 6dB. This was with the high 100k ohm load; with a demanding 600 ohm load, the second harmonic rose almost to the same level as the third; but at –90dB (0.003%), both are still very low in absolute terms (fig.14). Testing for intermodulation distortion with an equal mix of 19 and 20kHz tones, I reduced the peak signal level to –3dB, as the usual full-scale signal gave rise to a lot of aliasing products with the slow-rolloff SR and MQA filters. With the FR filter (fig.15), the images of the fundamental tones are suppressed by 90dB compared with the 10dB offered by the SR filter (fig.16), but with both filters the second-order difference product at 1kHz is virtually nonexistent.
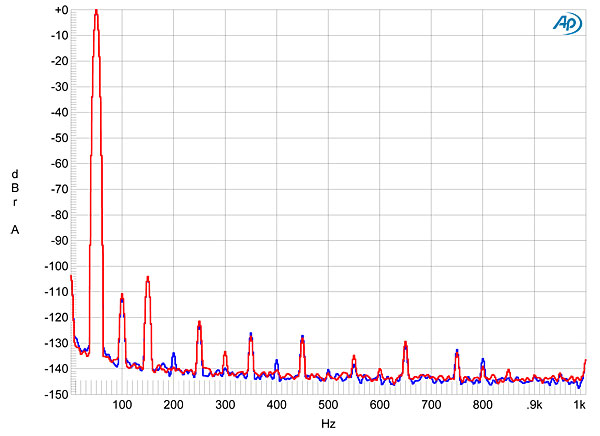
Fig.13 Mytek Brooklyn, digital input, spectrum of 50Hz sinewave, DC–1kHz, at 0dBFS into 100k ohms (left channel blue, right red; linear frequency scale).
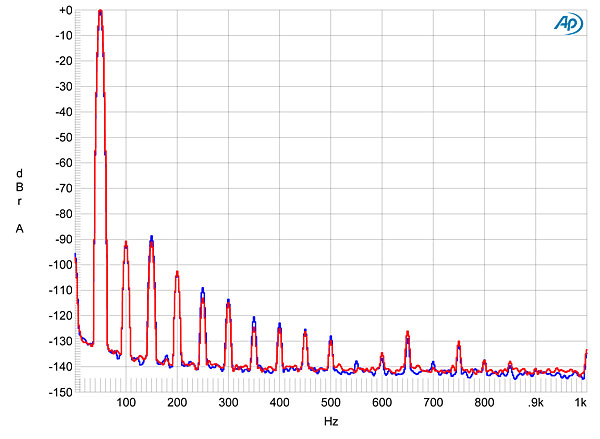
Fig.14 Mytek Brooklyn, digital input, spectrum of 50Hz sinewave, DC–1kHz, at 0dBFS into 600 ohms (left channel blue, right red; linear frequency scale).
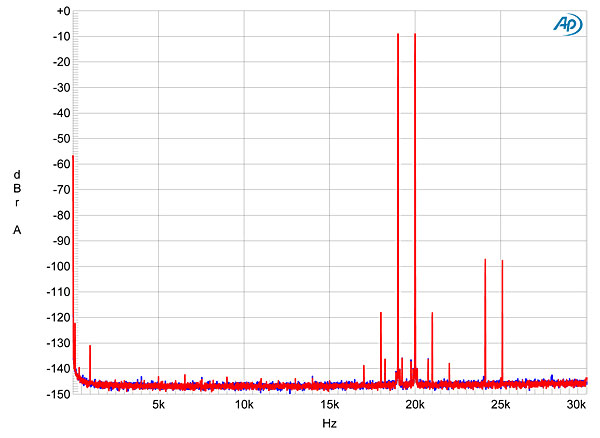
Fig.15 Mytek Brooklyn, digital input, FR filter, HF intermodulation spectrum, DC–30kHz, 19+20kHz at –3dBFS into 100k ohms, 44.1kHz data (left channel blue, right red; linear frequency scale).
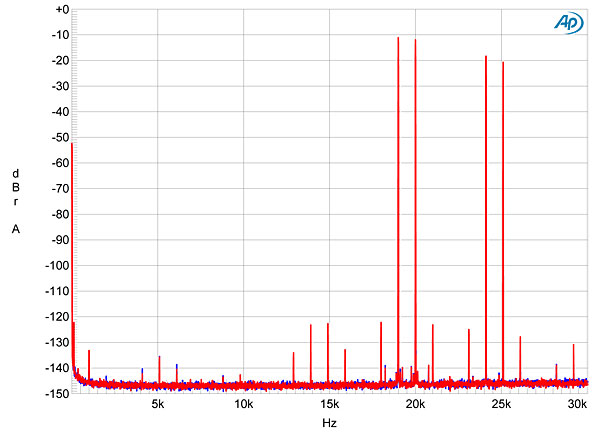
Fig.16 Mytek Brooklyn, digital input, SR filter, HF intermodulation spectrum, DC–30kHz, 19+20kHz at –3dBFS into 100k ohms, 44.1kHz data (left channel blue, right red; linear frequency scale).
Even in the worst case, the optical S/PDIF input, the Brooklyn featured superb rejection of word-clock jitter with 16-bit J-Test data (fig.17). With 24-bit data, however, an idle tone can be seen at 9.8kHz (fig.18), though this is at an extremely low level in absolute terms.
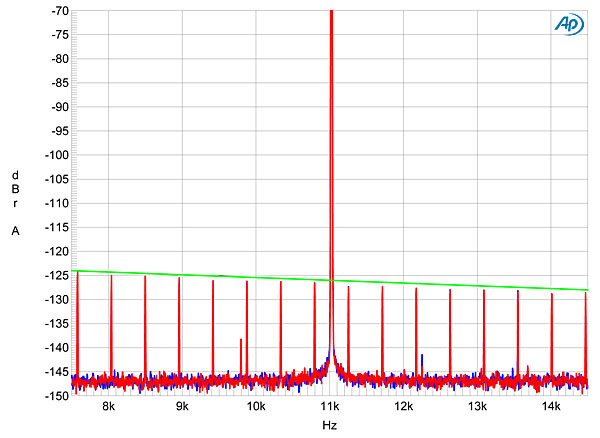
Fig.17 Mytek Brooklyn, digital input (TosLink), high-resolution jitter spectrum of analog output signal, 11.025kHz at –6dBFS, sampled at 44.1kHz with LSB toggled at 229Hz: 16-bit TosLink data (left channel blue, right red). Center frequency of trace, 11.025kHz; frequency range, ±3.5kHz.
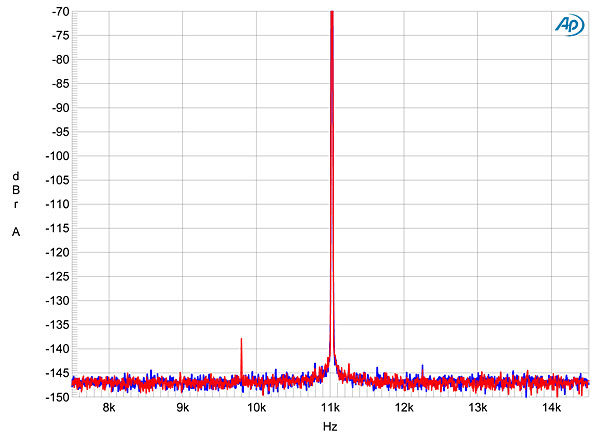
Fig.18 Mytek Brooklyn, high-resolution jitter spectrum of analog output signal, 11.025kHz at –6dBFS, sampled at 44.1kHz with LSB toggled at 229Hz: 24-bit TosLink data (left channel blue, right red). Center frequency of trace, 11.025kHz; frequency range, ±3.5kHz.
Turning to the Brooklyn's analog input set to Line, this offered unity gain at the RCA output jacks and 6dB of gain from the XLR and headphone jacks. The input impedance was a low 3.3k ohms from 20Hz to 20kHz, the frequency response was flat from 10Hz to 100kHz, and the signal was in inverted polarity from all three sets of outputs.
When I set the analog input to MM Phono, the input impedance was close to 47k ohms across the audioband, the output was still inverted, and the gain at 1kHz was now 55.6dB—on the high side for moving-magnet cartridges. Even so, the overload margin was very good, at 16.5dB at low and middle frequencies, dropping slightly to 13.6dB at 20kHz; the wideband, unweighted signal/noise ratio was also excellent, at 72.5dB ref. 1kHz at 5mV.
I then set the input to MC Phono: the gain at 1kHz increased to 72.6dB, the input impedance dropped to 990 ohms, and the overload margin was close to 20dB across the audioband. The unweighted S/N ratio (ref. 1kHz at 500µV) was now 58.6dB, which is still good, especially when you consider the very high gain and the presence of much digital circuitry in close proximity. RIAA error consisted primarily of a small plateau in the treble in both channels (fig.19), though the right channel (red trace) has 0.25dB more midrange energy than the left. Harmonic distortion via the MM and MC settings of the Analog input was also low (fig.20), as was intermodulation distortion (fig.21).
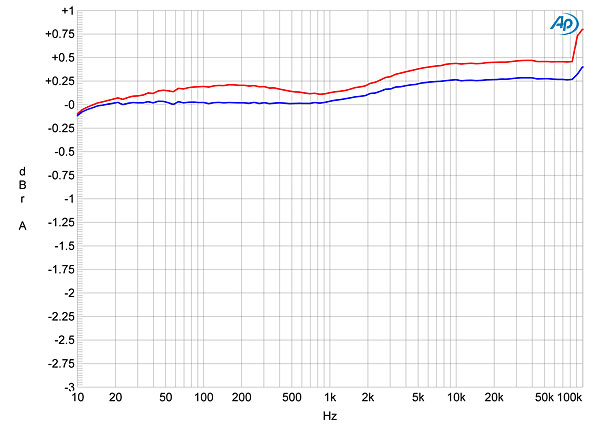
Fig.19 Mytek Brooklyn, MM analog input, response with RIAA correction (left channel blue, right red) (0.5dB/vertical div.).
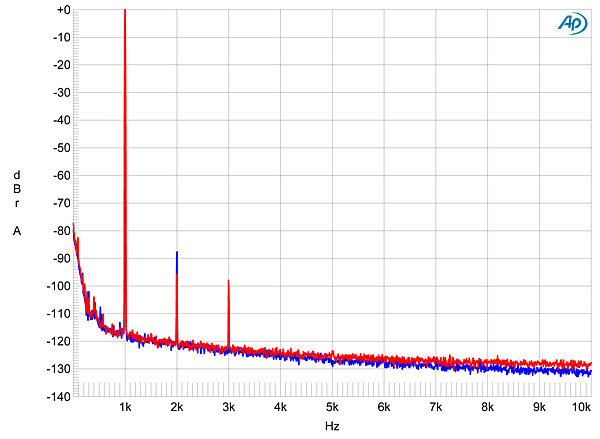
Fig.20 Mytek Brooklyn, MM analog input, spectrum of 1kHz sinewave, DC–1kHz, at 6V into 100k ohms (left channel blue, right red; linear frequency scale).
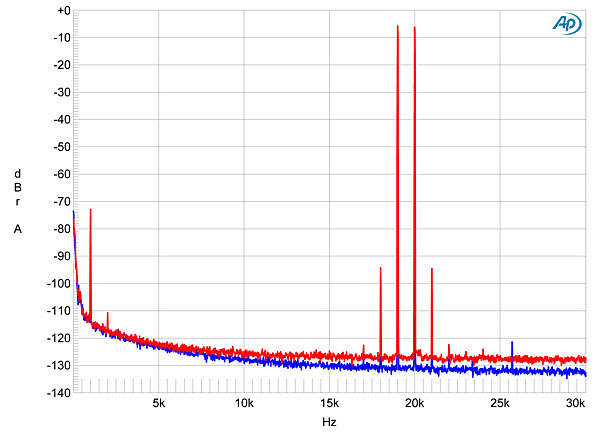
Fig.21 Mytek Brooklyn, MM analog input, HF intermodulation spectrum, DC–30kHz, 19+20kHz at 6V into 100k ohms (left channel blue, right red; linear frequency scale).
The Mytek Brooklyn's measured performance is superb, and not least when you consider how much functionality and versatility are packed into its small case. Color me impressed.—John Atkinson
Footnote 1: My thanks to Jürgen Reis of MBL for suggesting this test to me.
Footnote 2 :This filter is identical to that used in Meridian's MQA-capable Explorer2. See fig.4 here.
NEXT: Herb Reichert May 2017 »
|
|
| ||||||||||
- Log in or register to post comments


| Loudspeakers Amplification Digital Sources | Analog Sources Accessories Featured | Music Columns Retired Columns | Show Reports | Features Latest News Community | Resources Subscriptions |
 © 2024 Stereophile
AVTech Media Americas Inc., USA
All rights reserved

