| Columns Retired Columns & Blogs |
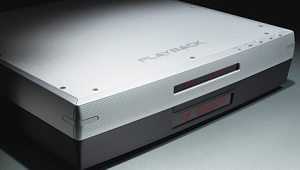
Muse Polyhymnia universal player Measurements
Sidebar 3: Measurements
After connecting the Muse Polyhymnia to a TV monitor, to make sure it was set up optimally and that such features as Dynamic Range Compression (DRC) were set to "Off," I tested it from its balanced and unbalanced output jacks. At 1.99V, the maximum output at 1kHz from DVD-Audio and CD was very close to the CD standard's 2V, although, unusually, it was identical from the balanced and unbalanced outputs. The maximum level for SACD was significantly lower, at 1.68V. This 1.5dB difference will invalidate any non–level-compensated comparisons among the three media. Both sets of outputs were non-inverting, with the XLRs wired with pin 2 hot. The Polyhymnia's output impedance was also the same from both sets of outputs: a low 152 ohms.
Error correction was, as with the Marantz SA8001 also reviewed in this issue, the best I have encountered—the Muse produced no audible glitches in its output until the gaps in the data spiral on the Pierre Verany Test CD reached 3mm in length! I usually monitor a player's data output with RME's DIGICheck program when I run this test, to see when the error flag is set, which generally happens before audible problems are heard. When I did this, I noticed that all 24 bits in the Polyhymnia's digital output were active—even with 16-bit data, which is unusual.
Looking at the player's frequency response, this was identical within the audioband for all three media (fig.1). DVD-A data cut off sharply above 45kHz, as expected, while SACD data continued the gentle ultrasonic rolloff above that frequency, reaching –13.5dB at 100kHz. The very nonflat traces in fig.1 were taken with pre-emphasized CD data. The shape of the traces accurately reflects the pre-emphasis equalization curve, meaning that the Muse, like an increasing number of digital playback components, does not apply the necessary de-emphasis. Fortunately, pre-emphasized CDs are relatively rare, but if your Muse player sounds unacceptably shrill, you're playing a pre-emphasized disc.

Fig.1 Muse Polyhymnia, frequency response into 100k ohms (from top to bottom at 40kHz): 96kHz-sampled DVD-A data at –12dBFS, SACD data at –3dBFS. Top traces at 20kHz: pre-emphasized CD data at –12dBFS. Top traces at 20Hz: regular CD data at –12dBFS. (Right channel dashed, 0.5dB/vertical div.)
Channel separation was better than 100dB in both directions at all frequencies up to 15kHz from the balanced outputs, but was asymmetrical from the unbalanced jacks, at 107dB, R–L below 1kHz, but 88dB across the audioband, L–R (not shown). Looking at the oscilloscope screen confirmed that this was due to true crosstalk, not noise.
The Muse's noise floor is a little higher in level than the highest-resolution players I have measured, which might be connected with its lower-than-normal output level. This can be seen in fig.2, which shows spectral analyses, taken with a swept 1/3-octave bandpass filter, of the Polyhymnia's output while it played back dithered 16-bit CD data (top pair of traces) and 24-bit DVD data (bottom traces), both representing a 1kHz tone at –90dBFS. The CD traces have a touch of second-harmonic distortion evident, but are otherwise dominated by the dither noise used to encode the signal on the CD.

Fig.2 Muse Polyhymnia, 1/3-octave spectrum with noise and spuriae of dithered 1kHz tone at –90dBFS (from top to bottom at 3kHz): 16-bit CD data, 24-bit DVD-A data (right channel dashed).
Increasing the bit depth drops the noise floor by 8dB, compared with the 20dB I've found with the highest-resolution players. However, the Polyhymnia will still resolve signals below the CD's limit, which is shown in fig.3, which compares the spectra of its output while it plays back SACD data representing dithered 1kHz tones at –90dBFS and –120dBFS. Peculiarly, these spectra are free from the second-harmonic content seen in the LPCM analyses in fig.2. On the positive side, note that all of these spectra are completely free from any power-supply–related spuriae.

Fig.3 Muse Polyhymnia, 1/3-octave spectrum with noise and spuriae of dithered 1kHz tone, SACD data, at (from top to bottom at 1kHz): –90dBFS, –120dBFS (right channel dashed).
Looking at the Muse's linearity error with CD data (fig.4), I was surprised to see a slight degree of negative error below –85dBFS. This error was absent with SACD data; it might correlate with the second-harmonic content evident in fig.2. (Energy is being transferred from the fundamental to the harmonic, reducing the absolute level of the former in a graph such as this.) But given the very low signal level at which this all occurs, along with the small amount of error, I suspect it is of academic interest only. The Polyhymnia's reproduction of an undithered tone on CD at exactly –90.31dBFS clearly revealed the three DC voltage levels (fig.5), though the slight waveform asymmetry correlates with the second-harmonic distortion noted with the dithered tones. Increasing the bit depth to 24 gave a nice-looking sinewave (fig.6).

Fig.4 Muse Polyhymnia, left-channel departure from linearity, 16-bit data (2dB/vertical div.).

Fig.5 Muse Polyhymnia, waveform of undithered 1kHz sinewave at –90.31dBFS, 16-bit data.

Fig.6 Muse Polyhymnia, waveform of undithered 1kHz sinewave at –90.31dBFS, 24-bit data.
Driving high-level tones into high impedances, the only harmonic apparent was the third, around –90dB (not shown). But into lower impedances, both some even-order harmonics and the fifth harmonic appeared (fig.7). The THD is still very low in absolute terms, however, at 0.005%. The picture was not quite as rosy when it came to the high-frequency intermodulation test (fig.8). The second-order difference component at 1kHz was low, at –93dBFS (0.0024%), but higher-order spuriae around the fundamental tones are present at a higher level. This behavior was not affected by dropping the load impedance, even to as low as 600 ohms, but I would still have rather not seen it.

Fig.7 Muse Polyhymnia, spectrum of 1kHz sinewave at 0dBFS into 5k ohms (linear frequency scale).

Fig.8 Muse Polyhymnia, HF intermodulation spectrum, 19+20kHz at 0dBFS peak into 5k ohms (linear frequency scale).
Finally, assessed with the Miller Audio Research Jitter Analyzer with 16-bit (CD) and 24-bit (DVD) data, the Polyhymnia demonstrated very good rejection of word-clock jitter, at a respective 361 and 273 picoseconds peak–peak. The increase in jitter with CD data was mainly due to the introduction of a pair of data-related sidebands at ±230Hz (fig.9, red "4" markers), plus some sideband pairs at higher frequencies (purple numeric markers), these of unknown origin.

Fig.9 Muse Polyhymnia, high-resolution jitter spectrum of analog output signal (11.025kHz at –6dBFS, sampled at 44.1kHz with LSB toggled at 229Hz), 16-bit CD data. Center frequency of trace, 11.025kHz; frequency range, ±3.5kHz.
Overall, the Muse Polyhymnia demonstrated good measured performance, but I was puzzled by its slightly worse low-level linearity with LPCM data compared with SACD data.—John Atkinson
- Log in or register to post comments

