| Columns Retired Columns & Blogs |
Mirage M-3 loudspeaker Measurements
Sidebar 3: Measurements
While not as crisp in appearance as that from several recent loudspeakers reviewed in Stereophile, the MLSSA-derived impulse response in fig.1 shows good control, the soft-dome tweeter exhibiting none of the (ultrasonic) ringing evident from metal domes. The step response (fig.2) indicates that all the drive-units are connected in the same positive acoustic polarity, with each step handing over smoothly to the next lower in frequency, which implies a crossover that has been optimized in the frequency domain. However, the relatively low amplitude of the tweeter step on the left of this graph suggests a rather mellow balance.
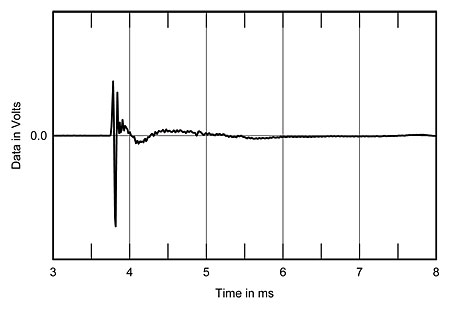
Fig.1 Mirage M-3, impulse response on listening axis at 50" (5ms time window, 30kHz bandwidth).
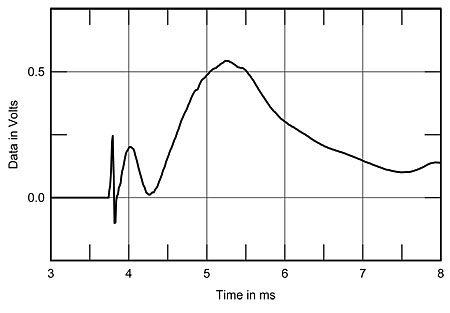
Fig.2 Mirage M-3, step response on listening axis at 50" (5ms time window, 30kHz bandwidth).
The very low port tuning (about 24Hz) and easy-to-drive impedance of the M-3 are evident in the impedance plot, fig.3. The magnitude of the impedance only drops below 4 ohms very briefly, at about 12–13kHz. No reasonably designed amplifier of appropriate power should have any problem in driving the M-3.
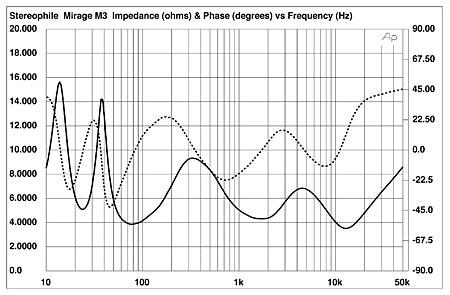
Fig.3 Mirage M-3, electrical impedance (solid) and phase (dashed). (2 ohms/vertical div.)
Fig.4 shows the separate, FFT-derived responses (on-axis) of the woofer and the midrange/tweeter combination, spliced to the (Audio Precision–derived) nearfield measurements for both the woofer and the port. Note particularly the rapid and, perhaps more important, smooth rolloff in the woofer's response—giving it little opportunity to color the midrange with spurious output. There are several things to note here. The port response is for one of the two ports in the rear of the enclosure. It shows, again, the port tuning in the mid-20s region. It also indicates a slight discontinuity, about 10–12dB down in level from the maximum output, which might contribute something to the slight fullness noted in the midbass. More likely is the contribution of what appears to be a small rise between about 60–80Hz.
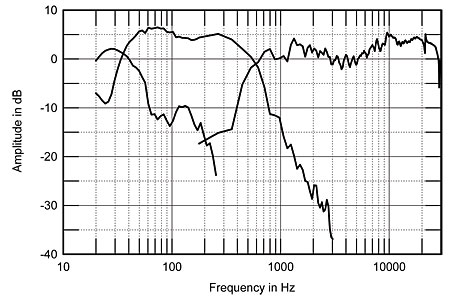
Fig.4 Mirage M-3, acoustic crossover on listening axis at 45", corrected for microphone response, with the nearfield responses of the woofer and port plotted below 250Hz.
My personal feeling is that this bump in the M-3's response—fairly mild in itself—combines with room modes in the same region to produce the fullness noted. (Such modes are quite common, in this frequency range, in many rooms.) Note also that the level for the port output shown is relative and does not necessarily relate directly to the level of the curve for the loudspeaker output.
The curve in fig.5 shows the FFT (MLSSA)–derived response averaged across a 30° horizontal window on the listening axis. The entire treble region appears to be shelved down a little. Fig.6 gives the 60°-averaged FFT response for the rear-radiating drivers. Note that the response below 400Hz comes primarily from the front-mounted woofer. We deliberately used a broad, 60° lateral window for this measurement since all of the rear energy is reflected before it is heard by a listener.
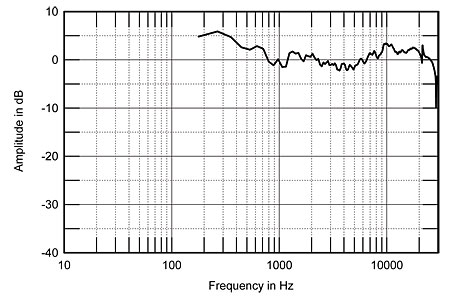
Fig.5 Mirage M-3, anechoic response on midrange axis at 45", averaged across 30° horizontal window and corrected for microphone response.
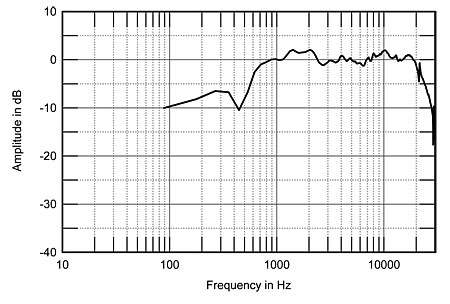
Fig.6 Mirage M-3, anechoic response on rear-midrange axis at 45", averaged across 60° horizontal window and corrected for microphone response.
In the families of curves shown in figs.7 and 8, the response over a broad vertical window is clearly shown to be rather consistent; listening height is fairly noncritical until you get very low or very high. While the response would seem to be top-heavy, the ear appears to respond more strongly to the broad depression through the upper midrange, giving the M-3 that slightly laid-back sound. But caution is advised in interpreting these curves because of the unique radiating pattern of the M-3. What the ear hears is some combination of the curves in figs.5, 7, and 8 combined with the reflected energy resulting from the output in fig.6. How the ear processes and interprets the confluence is a matter which measurements alone cannot really tell us. At present, only the ear can settle the matter.
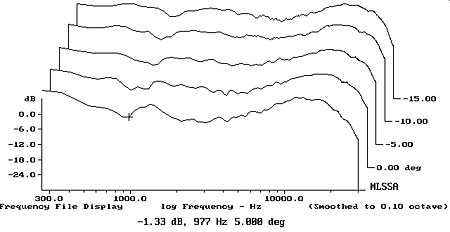
Fig.7 Mirage M-3, vertical response family at 45", from back to front: differences in response 23㬃.5° above axis, response on listening axis, differences in response 7.5° below axis.
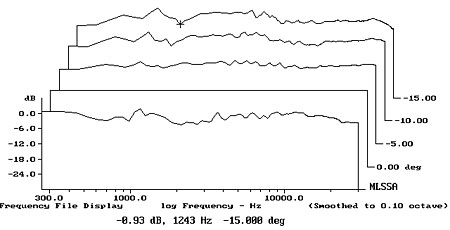
Fig.8 Mirage M-3, vertical response family at 45", normalized to response on listening axis, from back to front: differences in response 23㬃.5° above axis, reference response, differences in response 7.5° below axis.
The waterfall plot in fig.9 shows a lack of serious resonances within the audible range (the one at around 20kHz and another higher up are probably due to the computer monitor). Compared with most of the soft-dome tweeters we have measured in other loudspeakers, and some of the metal domes as well, the M-3's tweeter shows noticeably less "hash" across the lower treble as its impulse response decays.—Thomas J. Norton
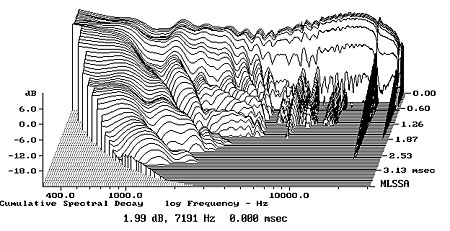
Fig.9 Mirage M-3, cumulative spectral-decay plot at 45" (0.15ms risetime).
|
| ||||||||||
- Log in or register to post comments


| Loudspeakers Amplification Digital Sources | Analog Sources Accessories Featured | Music Columns Retired Columns | Show Reports | Features Latest News Community | Resources Subscriptions |
 © 2024 Stereophile
AVTech Media Americas Inc., USA
All rights reserved

