| Columns Retired Columns & Blogs |
Mirage M-1si loudspeaker Measurements
Sidebar 3: Measurements
The Mirage M-1si's impedance curve in fig.1 indicates a load which should be easy to drive. The magnitude of the impedance never drops below 4 ohms or rises above 8.3 ohms, except at the lowest and highest frequencies. The peak at 24.6kHz could be caused by a "trap filter" to tame the high-frequency resonance of the tweeter. The average tuning of the ports is 29Hz—indicated by the "saddle" between the double peaks in the bass magnitude plot. The smaller peaks at 300Hz and 2.5kHz are a reflection of the effective electrical crossover points, the former somewhat different from the specified 400Hz. (Mirage's printed literature gives the crossover as 300Hz, but information furnished to us just prior to this writing states that the crossover point is 400Hz.)

Fig.1 Mirage M-1si, electrical impedance (solid) and phase (dashed) (2 ohms/vertical div.).
The (B-weighted) sensitivity of the M-1si, with 2.83V input, was 83 to 83.5dB at 1 meter. This is quite insensitive; but to put it in perspective, it's about 1dB higher than the sensitivity of the BBC LS3/5A and 1.5–2dB lower than the recently reviewed Vandersteen 3. While I never had any trouble driving the M-1si to the loudest levels I felt comfortable with—which may not necessarily reflect others' tastes in output level—even with less than behemoth amplification, the Mirage's low sensitivity may have been at least partially responsible for my observation that it was at times reluctant to jump or boogie enthusiastically when called for. A lower-midrange dip in the combined off-axis and rear responses (discussed later here) may also have contributed to this characteristic.
It should also be noted that our 7000' elevation here in Santa Fe results in a somewhat lower sensitivity measurement than at sea level, which is the reason we relate sensitivities measured here to those of other loudspeakers—to provide a basis for comparison. (The sensitivity difference is the only significant measurable effect which we have found relative to our higher elevation. For more on this subject, see JA's discussions in Vol.10 No.7, p.137, and Vol.13 No.5, p.5.)
The impulse response of the Mirage, taken on the tweeter axis, is shown in fig.2. The pulse has a fast risetime, followed by ultrasonic ringing—often seen in metal-dome tweeters. The step response, shown in fig.3 (see JA's review of the Vandersteen 3 in March, p.140, for more background on this test), indicates that the response of the tweeter (the initial pulse) is positive-going, followed by the response of the midrange—the latter's negative-going response indicating that it is connected out of phase with the tweeter (and with the woofer as well, whose contribution is indicated by the second, slower positive rise at about 5ms).
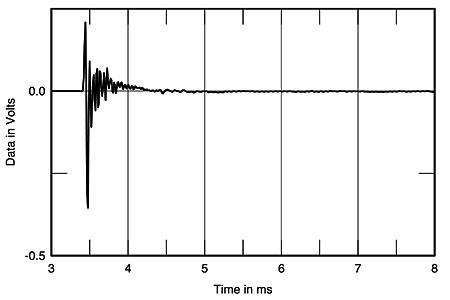
Fig.2 Mirage M-1si, impulse response on listening axis at 45" (5ms time window, 30kHz bandwidth).
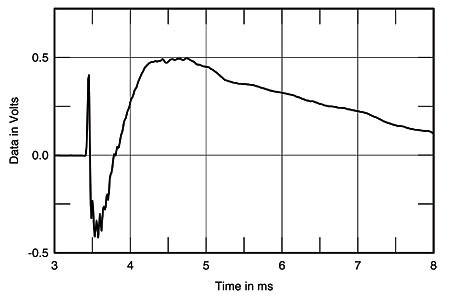
Fig.3 Mirage M-1si, step response on listening axis at 45" (5ms time window, 30kHz bandwidth).
Second-order (12dB/octave) crossovers are generally connected in this manner. The electrical performance of a second-order crossover inherently results in the inputs to the drivers being 180° out of phase at the crossover frequency. Connecting the drivers to this crossover electrically in-phase will therefore result in the drivers being acoustically out of phase at the crossover point—with a resulting dip in the amplitude response. Wiring the drivers out of phase with a second-order crossover will give a smoother amplitude response through the crossover region at the expense of the speaker's time coherence.
The quasi-anechoic response of the M-1si, averaged across a 30° window on the listening axis, is shown in fig.4 (top curve). The response below about 200Hz is the complex sum of the nearfield outputs of the two woofers and the two ports, all of which will be relatively omnidirectional below this frequency. This measurement was taken at 39" from the floor—roughly at the top of the woofer and the axis used during most of the listening tests—and at a distance of 45" from the loudspeaker. (Note that this is a different axis from that used in the corresponding curve in the M-3si measurements in GL's review in November '92, Vol.15 No.11, p.140. To make a more direct comparison, refer to fig.5 in that review, which was taken on the woofer axis.)
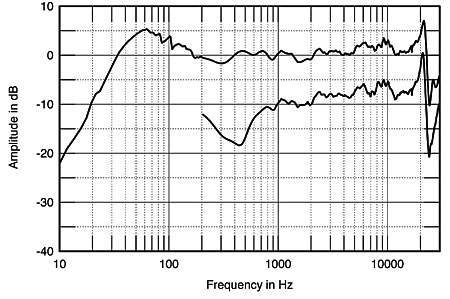
Fig.4 Mirage M-1si, anechoic response on listening axis at 45", averaged across 30° horizontal window and corrected for microphone response, with complex sum of nearfield woofer and port responses plotted below 300Hz (top); response on rear-facing axis (bottom).
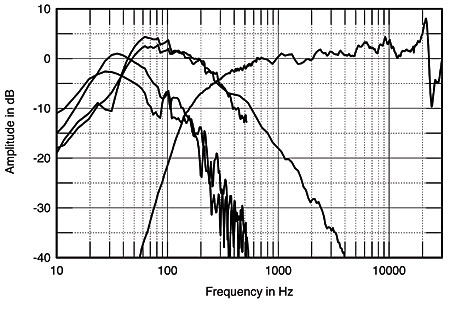
Fig.5 Mirage M-1si, acoustic crossover on tweeter axis at 45", corrected for microphone response, with nearfield woofer and port responses plotted below 500Hz and 3.5kHz, respectively.
The Mirage's response is very linear from 400Hz to the limits of the audible range, with a slight emphasis between 5–10kHz and the more obvious resonant peak of the tweeter just above 20kHz the only deviations worth commenting on. The former was not obvious in the listening results, though it may account for the slight grain I noted early in my auditioning. The response takes a nosedive immediately above the ultrasonic resonant peak. My first reaction to this was that it might be due to a slightly misaligned trap filter designed to damp the metal-dome tweeter resonance, but if so, it also exists in the response we measured in the M-3si. The bottom end of the response has a slight dip from 200–400Hz (though the data are somewhat unreliable in this region) and a peak of about +5dB centered at 50–60Hz, the latter probably at least partially responsible for the warmth sometimes noted in the sound (though room interactions certainly cannot be cleared of suspicion in this). Though the response drops rapidly below 50Hz, room reinforcement should make the slope considerably shallower and the resultant extension significantly lower (recall that our measurements show a nearfield, near-anechoic response).
The bottom curve in fig.4 indicates the response measured at the same height and distance from the back of the M-1si. Above about 700Hz the response is virtually the same as from the front. From 700Hz down to 200Hz (the lower limit of the measurement) there is a noticeable dip. When combined with the smaller dip in the front measurement in a slightly lower frequency band and the dip in the off-axis response to the inside, drive-unit side of the baffle—see later—the in-room soundfield will be deficient in midrange energy, which might account for the Mirage's laid-back quality.
The rather busy graph in fig.5 shows the individual contributions of all of the drivers and ports to the total response of fig.4. Note the slightly different tuning frequencies (and output levels) of the two ports, which do not show up in the impedance plot. The higher output level of the lower port is perhaps a function of proximity of the floor to the microphone and port; even with the close mike-to-port distance used, the nearness of the floor to the port cannot be entirely discounted. Also worth noting are the smooth rollout of the woofers and the fact that the acoustical woofer-to-midrange crossover appears to be closer to 300Hz rather than the specified 400Hz point, a point also noted in the impedance measurements above.
The lateral response family of the M-1si is shown in fig.6, normalized to the on-axis response. (That is, the on-axis response deviations are subtracted from all the curves, therefore showing only the changes which result from a hypothetically flat on-axis response as we move off-axis.) The traces at the front of fig.6 indicate the response changes toward the inside; that is, toward the center as the loudspeakers would normally be set up (the side to which the mirror-imaged drivers are offset); those to the rear of this graph show the response changes in the opposite direction. In both cases the graph shows excellent treble dispersion up to 30° off-axis and even beyond. Notice, however, that the response toward the inside shows a noticeable midrange dip in the off-axis response, a dip not visible to nearly the same degree in the other direction.
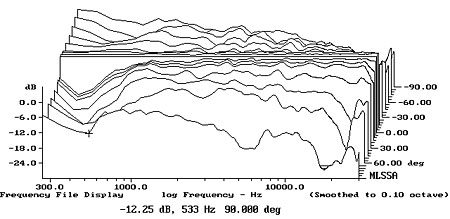
Fig.6 Mirage M-1si, horizontal response family at 45", normalized to response on tweeter axis, from back to front: differences in response 90°–5° off-axis on midrange side of baffle; reference response; differences in response 5°–90° off-axis on tweeter side of baffle.
This may indicate why I preferred the M-1sis aimed toward the listening position rather than straight ahead. The measured dip might also be due to the increasing contribution of the rear radiation to the frontal response as the loudspeaker is rotated past straight-ahead, and the resultant interference pattern between the front and rear outputs. The effect of this would vary in the two directions due to the offset of the drivers. While this interference pattern may be judged a measurement artifact when considering the anechoic response of the loudspeaker, it would nevertheless exist within the room in normal use and contribute to the loudspeaker's overall room response.
The vertical response family of fig.7 (again normalized to the listening axis at about 39" above the floor, or at the top of the woofer) shows a very consistent response from well below the woofer height to just about the midrange axis. Above this, the high end increases significantly and a suckout develops in the upper crossover region. This is important to note when auditioning the M-1si: Don't judge it critically while standing up! While the design of the M-1si results in a physically high midrange and tweeter, Mirage has thankfully tailored the response to be optimum at a typical listening height—something too often ignored by otherwise competent loudspeaker designers, and a pet peeve of mine.
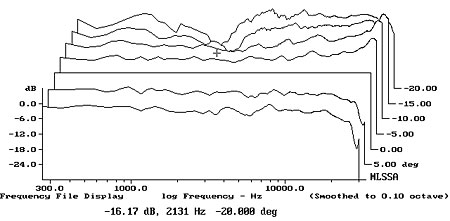
Fig.7 Mirage M-1si, vertical response family at 45", normalized to response on tweeter axis, from back to front: differences in response 20°–5° above tweeter axis; reference response; differences in response 5°–10° below tweeter axis.
The waterfall plot in fig.8 is superb (ignore the darkened ridge at about 15kHz; this is the whistle from the computer monitor). Note the rapid die-off on the time axis across the band (especially above 1kHz), the very smooth overall response, and the lack of serious resonances. There is only a small series of low-level resonances around 8–10kHz, which correspond with a small irregularity in the response of fig.4 at the same frequency. The high-frequency response, in particular, is notably free of hash.
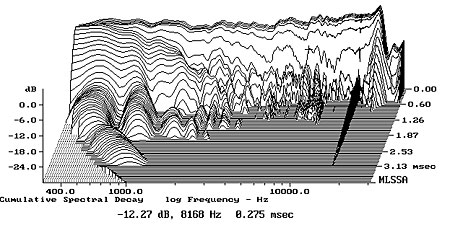
Fig.8 Mirage M-1si, cumulative spectral-decay plot at 45" (0.15ms risetime).
The overall measurements of the M-1si are superb. They were taken, as is our usual practice, after the listening tests were completed. I found nothing in the "bench" results to contradict the evidence of my ears.—Thomas J. Norton
NEXT: Tom Norton returns »
|
| ||||||||||
- Log in or register to post comments


| Loudspeakers Amplification Digital Sources | Analog Sources Accessories Featured | Music Columns Retired Columns | Show Reports | Features Latest News Community | Resources Subscriptions |
 © 2024 Stereophile
AVTech Media Americas Inc., USA
All rights reserved

