| Columns Retired Columns & Blogs |
McIntosh Labs MC2000 power amplifier Measurements part 2
The THD+noise percentage vs frequency results are plotted in figs.4 and 5. The amplifier is obviously very linear, other than at very low frequencies (though the fact that the right channel is better than the left in this respect might indicate a bias problem). Fig.5 shows a comparison of the balanced and unbalanced measurements, which are quite similar. The McIntosh's distortion waveform at 2W into 4 ohms (fig.6) indicates the presence of second and third harmonics and some higher-order components, as well as noise.
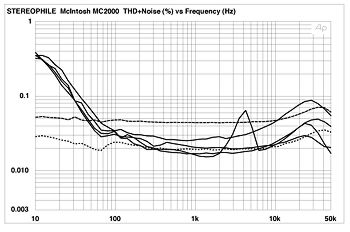
Fig.4 McIntosh MC2000, balanced, THD+noise (%) vs frequency at (from top to bottom at 4kHz): 2.83V into simulated loudspeaker load; 4W into 2 ohms; 2W into 4 ohms; and 1W into 8 ohms.

Fig.5 McIntosh MC2000, THD+noise (%) vs frequency at (from top to bottom at 6kHz): 2W into 4 ohms, unbalanced; 1W into 8 ohms, unbalanced; 1W into 8 ohms, balanced; and 2W into 4 ohms, balanced.

Fig.6 McIntosh MC2000, 1kHz waveform at 2W into 4 ohms (top), distortion and noise waveform with fundamental notched out (bottom, not to scale).
A spectrum of the MC2000's output while it drives a 50Hz tone at 87W into 4 ohms (two-thirds rated power) is shown in fig.7. This is a fairly unimpressive result, though the highest-level component, the second harmonic at 100Hz, is still a relatively low 0.25% (-52.7dB). The amplifier is more linear at higher frequencies. Fig.8 shows the IM distortion resulting from a combined 19+20kHz signal at 83.5W into 4 ohms. Again, the maximum distortion is approximately 0.13% (-58dB) at 1kHz. At the same power into 8 ohms, the IM distortion is only marginally lower (not shown).
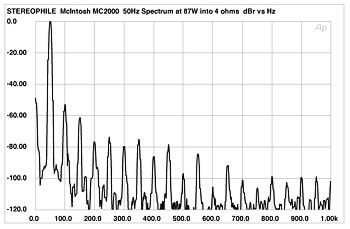
Fig.7 McIntosh MC2000, spectrum of 50Hz sinewave, DC-1kHz, at 87W into 4 ohms, 4 ohm tap (linear frequency scale).

Fig.8 McIntosh MC2000, HF intermodulation spectrum, DC-22kHz, 19+20kHz at 83.5W into 4 ohms, 4 ohm tap (linear frequency scale).
NEXT: Measurements part 3 »
|
|
| ||||||||||
- Log in or register to post comments


| Loudspeakers Amplification Digital Sources | Analog Sources Accessories Featured | Music Columns Retired Columns | Show Reports | Features Latest News Community | Resources Subscriptions |
 © 2024 Stereophile
AVTech Media Americas Inc., USA
All rights reserved

