| Columns Retired Columns & Blogs |
MartinLogan SL3 loudspeaker Measurements part 3
In the time domain, the SL3's step response (fig.5) is beautifully coherent, the rise away from the time axis being almost vertical. Further analysis is difficult, so I have also shown the individual step responses of the panel and woofer (fig.6), plotted to a slightly different scale. The panel can be seen to overshoot the time axis on the return of its step to zero, with its second positive-going move overlaid with the slow rise of the woofer output. There will be some cancellation between the two drivers, meaning that the SL3 owner should experiment with the room placement to get the optimal blend between the two drivers in the lower midrange. I do note that WP was not bothered by any integration problems in his room.

Fig.5 Martin-Logan SL3, step response on mid-panel axis at 50" (5ms time window, 30kHz bandwidth).

Fig.6 Martin-Logan SL3, individual step responses of panel and woofer on mid-panel axis at 50" (7ms time window, 30kHz bandwidth).
Finally, the SL3's cumulative spectral-decay or waterfall plot (fig.7) doesn't look very good, there being ridges of delayed energy apparent in the low treble and a good deal of hashy behavior in the high treble. However, as WP found the speaker to sound clean and transparent, I must assume this graph looks worse than it is. However, I believe all panel speakers, to a greater or lesser degree, exhibit chaotic behavior (in the mathematical sense): Although the drive signal is uniform across the panel area, the panel itself "shimmers" or "wobbles" as it moves in response to that signal. In effect, some areas of the diaphragm move a little more than they should, others a little less, the result being the hashy-looking plot of fig.7. However, as long as the speaker designer knows what he is doing with regards to the physical aspects of the panel design, this will be to a large extent a random process. The ups and downs will therefore tend to cancel, leaving a subjectively clean reproduction of the input signal.—John Atkinson
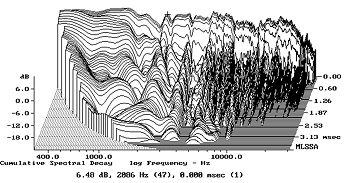
Fig.7 Martin-Logan SL3, cumulative spectral-decay plot at 50" (0.15ms risetime).
NEXT: Manufacturer's Comment »
|
|
| ||||||||||
- Log in or register to post comments


| Loudspeakers Amplification Digital Sources | Analog Sources Accessories Featured | Music Columns Retired Columns | Show Reports | Features Latest News Community | Resources Subscriptions |
 © 2024 Stereophile
AVTech Media Americas Inc., USA
All rights reserved

