| Columns Retired Columns & Blogs |
Mark Levinson No.532H power amplifier Measurements
Sidebar 3: Measurements
To perform the measurements on the Mark Levinson No.532H, I used Stereophile's loan sample of the top-of-the-line Audio Precision SYS2722 system (see the January 2008 "As We See It," and www.ap.com). Before testing the No.532H, I ran it at one-third power into 8 ohms for an hour, which maximally stresses a class-A/B amplifier's ability to shed waste heat. At the end of this preconditioning period the No.532H's top panel was warm, at 108°F (42.2°C), though the exposed tops of the internal heatsinks measured 168°F (75.5°C). This amplifier needs plenty of ventilation. The THD+noise present in the cold amplifier's output was 0.0019%; with the amplifier hot, this rose to a still very low 0.006%.
The voltage gain into 8 ohms was to specifications: at 26.8dB using the balanced inputs, and slightly higher, 27.2dB, using the unbalanced inputs. Both inputs preserved absolute polarity (ie, were non-inverting). The XLR jacks are wired with pin 2 hot. The input impedance at low and middle frequencies was slightly higher than specified, at 32.5k ohms unbalanced and 63k ohms balanced. However, these figures dropped to 13k and 31k ohms at 20kHz, respectively.
The output impedance, including the series resistance of 6' of speaker cable, was very low, at <0.08 ohm at 20Hz and 1kHz, rising to 0.16 ohm at 20kHz. The variation in the amplifier's frequency response, due to the interaction between this impedance and how that of the speaker varies with frequency, is therefore also very low, at ±0.1dB (fig.1, gray trace). The No.532H's output drops by 0.5dB at 20kHz into 2 ohms (fig.1, green trace), but the response into higher impedances is –3dB at >100kHz, which correlates with the short risetimes with a 10kHz squarewave (fig.2). The 10kHz squarewave response is free from overshoot and ringing, and the low-frequency squarewave is essentially perfect (fig.3).
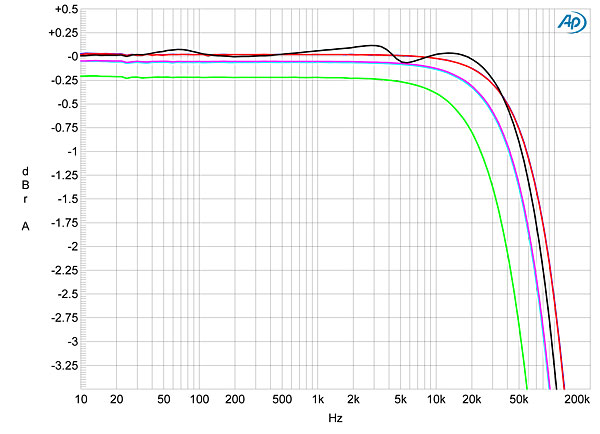
Fig.1 Mark Levinson No.532H, frequency response at 2.83V into: simulated loudspeaker load (gray), 8 ohms (left channel blue, right red), 4 ohms (left cyan, right magenta), 2 ohms (green). (1dB/vertical div.)

Fig.2 Mark Levinson No.532H, small-signal 10kHz squarewave into 8 ohms.
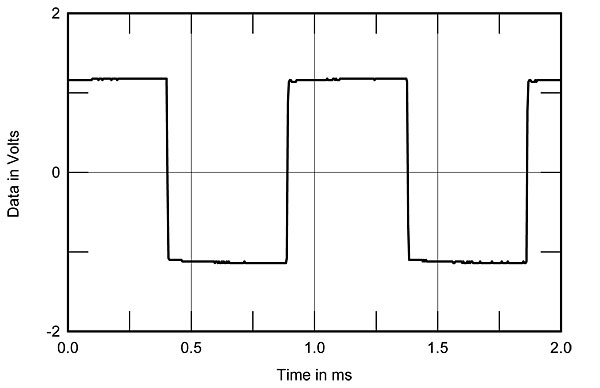
Fig.3 Mark Levinson No.532H, small-signal 1kHz squarewave into 8 ohms.
Channel separation (not shown) was >100dB in both directions below 1kHz, and at 20kHz was still 81dB (R–L) and 85dB (L–R). The No.532H is also superbly quiet; its wideband, unweighted signal/noise ratio, ref. 2.83V output with the input short-circuited, measured 93dB in both channels. (The A-weighted ratio was 105.4dB.) With its high output power, the No.532H is one of the few amplifiers that can match the dynamic range of true high-resolution recordings.
Fig.4 shows how the THD+N percentage in the No.532H's output varies with output power into 8, 4, and 2 ohms. The THD starts to rise above 28V RMS into each load, but actual clipping occurs significantly higher in level. Defining clipping as 1% THD+N, the No.532H clips at 355Wpc into 8 ohms (25.5dBW), at 500Wpc into 4 ohms (24.8dBW), and, with one channel driven, at 660W into 2 ohms (22.2dBW). The amplifier turned itself off at 671W into 2 ohms, but turned itself back on again when the drive signal was reduced. Though the distortion at lower frequencies is extremely low even at moderate power levels (fig.5), it does start to rise in the treble. This is due to the circuit's restricted open-loop bandwidth reducing the amount of corrective negative feedback applied as the frequency rises. However, the distortion at 20kHz is still very low, even into 2 ohms (fig.5, green trace).

Fig.4 Mark Levinson No.532H, distortion (%) vs 1kHz continuous output power into (from bottom to top at 100W): 8, 4, 2 ohms.

Fig.5 Mark Levinson No.532H, THD+N (%) vs frequency at 10V into: 8 ohms (left channel blue, right red), 4 ohms (left cyan, right magenta), 2 ohms (green).
Though low in level, the distortion comprises both low and high orders (fig.6). At high currents, the third harmonic begins to predominate (fig.7). Though the higher-order spuriae are still present, their levels are very low, even close to visual waveform clipping on an oscilloscope (fig.8). Intermodulation distortion is also extremely low, even at very high power (fig.9).
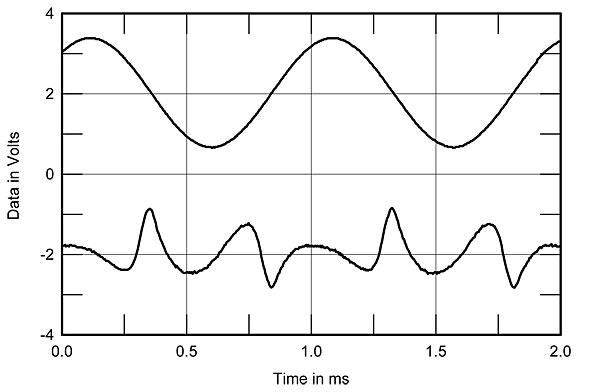
Fig.6 Mark Levinson No.532H, 1kHz waveform at 30W into 4 ohms (top), 0.0028% THD+N; distortion and noise waveform with fundamental notched out (bottom, not to scale).
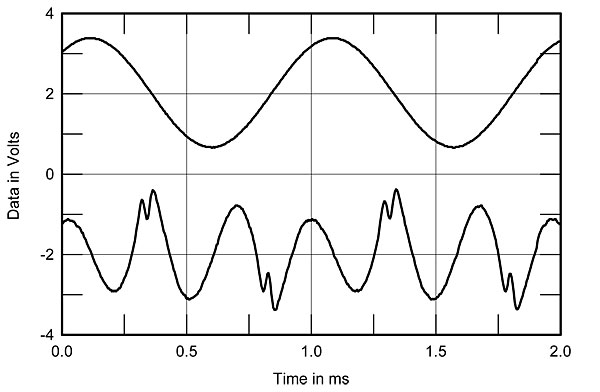
Fig.7 Mark Levinson No.532H, 1kHz waveform at 45W into 2 ohms (top), 0.0053% THD+N; distortion and noise waveform with fundamental notched out (bottom, not to scale).
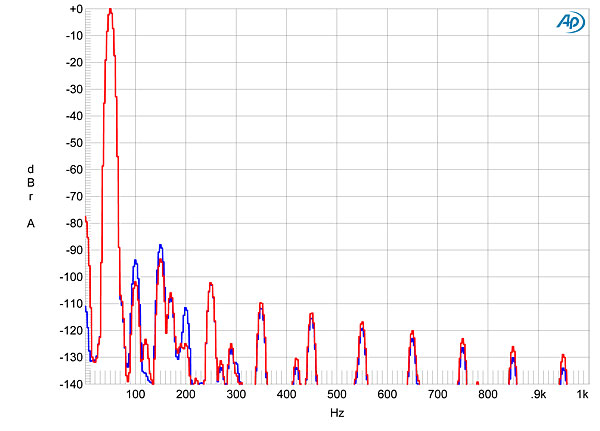
Fig.8 Mark Levinson No.532H, spectrum of 50Hz sinewave, DC–10kHz, at 275W into 4 ohms (left channel blue, right red; linear frequency scale).
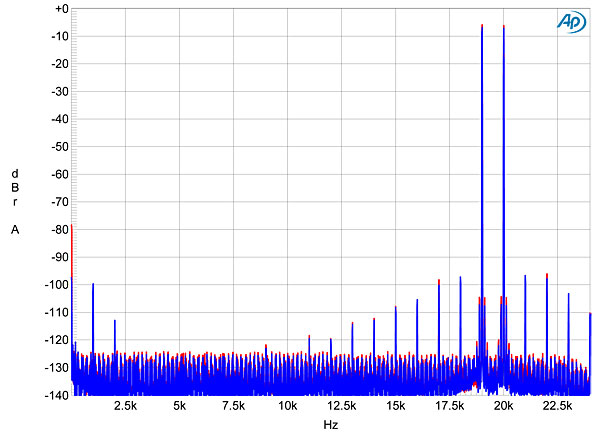
Fig.9 Mark Levinson No.532H, HF intermodulation spectrum, DC–24kHz, 19+20kHz at 260W peak into 4 ohms (linear frequency scale).
With its high power output and very low levels of noise and distortion, the Mark Levinson No.532H offers textbook measured performance.—John Atkinson
|
| ||||||||||
- Log in or register to post comments


| Loudspeakers Amplification Digital Sources | Analog Sources Accessories Featured | Music Columns Retired Columns | Show Reports | Features Latest News Community | Resources Subscriptions |
 © 2024 Stereophile
AVTech Media Americas Inc., USA
All rights reserved

