| Columns Retired Columns & Blogs |
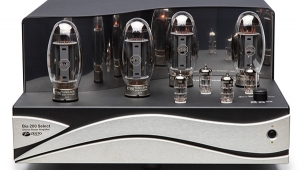
Manley Labs Reference 240 monoblock power amplifier Measurements
Sidebar 3: Measurements
A complete set of measurements was made on the Manley Reference 240 in both the triode and tetrode modes using the balanced inputs. Selected measurements were also made using the unbalanced inputs.
The Manley Reference 240 was warmed up for one hour at 60W into 8 ohms, one-third of its rated maximum power in the tetrode mode. Although the top plate became very hot, this was not enough to be an operational concern. However, it was hot enough that the amplifier should be kept out of reach of small fingers. (The same might be said of the sharp edges on the Manley logo forming the ventilation holes on the casing.)
The DC offset of the Reference 240 measured an inconsequential 0.6mV, triode, and 0.3mV, tetrode. The amplifier is non-inverting. The Reference 240's measured input impedance (at 1kHz), voltage gain into 8 ohms, and S/N ratio (ref. 1W into 8 ohms), to the nearest ohm and dB, are given in Table 1.
Table 1 Manley Reference 240: Voltage Gain & Noise
| Input Impedance k ohms |
Gain dB |
S/N 22Hz–22kHz dB unweighted |
S/N 10Hz–500kHz dB unweighted |
S/N 10Hz–500kHz dB A-weighted |
|
| Triode (balanced) | 118 | 32 | 67 | 65 | 77 |
| Triode (unbalanced) | 137 | 32 | 67 | 64 | 77 |
| Tetrode (balanced) | 116 | 34 | 65 | 60 | 76 |
| Tetrode (unbalanced) | 144 | 34 | 66 | 60 | 76 |
The amplifier's output impedance was at or under 0.77 ohms in the tetrode mode at low- and mid-frequencies, increasing to 0.87 ohms at 20kHz. In the triode mode, the corresponding figures were 0.83 ohms and 0.97 ohms. While this source impedance is not small enough to be irrelevant with real-world loads, I would expect it to have less of an effect on the amplifier's performance than is the case with most of the tube amplifiers I have tested recently, which have output impedances over 2 ohms and in some cases over 3 ohms.
Figs.1 & 2 show the frequency response of the Manley Reference 240. Here I have chosen to show the balanced results for all configurations in fig.1, and the balanced and unbalanced results into only an 8 ohm load in fig.2, to make for a clearer comparison. The real-world load variation, while definitely noticeable (and very likely audible) is never worse than –1dB up to 25kHz or higher. Fig.3 shows the Manley's small-signal 10kHz squarewave response. There is some slowing of the risetime, consistent with the measured high-frequency response, along with a small overshoot but no ringing. This is a good response for a tube amplifier. The 1kHz squarewave (not shown) is excellent except for the same small overshoot at the leading edge (barely visible at this frequency).

Fig.1 Manley 240, frequency response (from top to bottom at 20kHz): at 2W into 4 ohms, tetrode mode; 1W into 8 ohms, tetrode; 2W into 4 ohms, triode; 1W into 8 ohms, triode; 2W into simulated speaker load, tetrode; and 2W into simulated speaker load, triode (0.5dB/vertical div.).

Fig.2 Manley 240, frequency response at 1W into 8 ohms (from top to bottom at 20kHz): tetrode mode, balanced input; tetrode, unbalanced; triode, balanced; and triode, unbalanced (0.5dB/vertical div.).

Fig.3 Manley 240, small-signal 10kHz squarewave into 8 ohms.
The variation of the Manley's THD+noise with frequency (at 1kHz) is plotted in figs.4 & 5. Here again I have divided the results into two curves, the first for the tetrode response (balanced only) and the second for the results into 8 ohms (at 1W). These results are respectable for a tube amplifier, the main aberrations being the higher distortion into 2 ohms (a load not well-matched to this amp, also see below), and the rise in LF distortion below 50Hz when the 240 is running in tetrode mode. The 1kHz distortion waveform into an 8 ohm load is shown in figs.6 & 7 (tetrode and triode modes, respectively). It is heavily second-harmonic, though higher-order content is visible in the tetrode-mode trace.

Fig.4 Manley 240, tetrode mode, THD+noise vs frequency at (from top to bottom at 20kHz): 4W into 2 ohms, 2W into 4 ohms, 2.83V into simulated speaker load and 1W into 8 ohms.

Fig.5 Manley 240, THD+noise vs frequency at 1W into 8 ohms (from top to bottom at 30kHz): triode mode, unbalanced input; triode, balanced; tetrode, unbalanced; and tetrode, balanced.

Fig.6 Manley 240, tetrode mode, 1kHz waveform at 5W into 8 ohms (top); distortion and noise waveform with fundamental notched out (bottom, not to scale).

Fig.7 Manley 240, triode mode, 1kHz waveform at 5W into 8 ohms (top); distortion and noise waveform with fundamental notched out (bottom, not to scale).
Figs.8 & 9 show spectra of the Reference 240's output in response to a 50Hz input, taken at 160W (tetrode) and 67W (triode), respectively, into an 8 ohm load. (We normally use 4 ohms for this measurement, but the Manley's single set of output terminals are clearly more optimally matched to a 8 ohm load.) The results into a simulated real-world load were not substantially different (not shown). In the triode mode (fig.9), the largest artifacts are the second through the fourth harmonics, at –43dB (0.7%), –46dB (0.5%), and –52dB (0.25%), respectively. The remaining harmonics are below –60dB (0.1%), and the corresponding tetrode results (fig.8) are only slightly better (though at a much higher power output).

Fig.8 Manley 240, tetrode mode, spectrum of 50Hz sinewave, DC–1kHz, at 160W into 8 ohms (linear frequency scale). Note that the second harmonic at 100Hz is the highest in level, at –48dB (about 0.4%).

Fig.9 Manley 240, triode mode, spectrum of 50Hz sinewave, DC–1kHz, at 67W into 8 ohms (linear frequency scale). Note that the second harmonic at 100Hz is the highest in level, at –43dB (about 0.7%).
Feeding a combined 19kHz+20kHz signal into the Reference 240 produces the spectra shown in figs.10 & 11, at 158W, tetrode, and 69W, triode, respectively. Only the results with an 8 ohm load are shown here; the artifacts into a non-optimal 4 ohm load are somewhat higher in level, though not dramatically so. The 1kHz IM distortion lies at –58dB (about 0.12%), tetrode, –49dB (about 0.35%) triode; the 18kHz artifact also lies at –49dB, tetrode, and –33dB (just under 2.5%), triode.

Fig.10 Manley 240, tetrode mode, HF intermodulation spectrum, DC–22kHz, 19+20kHz at 158W into 8 ohms (linear frequency scale).

Fig.11 Manley 240, triode mode, HF intermodulation spectrum, DC–22kHz, 19+20kHz at 69W into 8 ohms (linear frequency scale).
The variation in the Manley 240's THD+noise with output power are shown in figs.12 (tetrode) and 13 (triode). Note that the power output in both operating modes is clearly optimum into an 8 ohm load, dropping dramatically into lower impedances. But also note that at a slightly higher, 3% distortion level, the triode output power into 4 ohms exceeds that into 8 ohms. The discrete clipping measurements (at 1% THD+noise) are shown in Table 2.

Fig.12 Manley 240, tetrode mode, distortion (%) vs output power into (from bottom to top): 8 ohms, 4 ohms, and 2 ohms.

Fig.13 Manley 240, triode mode, distortion (%) vs output power into (from bottom to top): 8 ohms, 4 ohms, and 2 ohms.
Table 2: Manley Reference 240 Clipping (1% THD+noise at 1kHz)
| Load ohms | Tetrode W (dBW) | Triode W (dBW) |
| 8 | 304.8 (24.8) | 203.5 (23.1) |
| (line) | 116V | 117V |
| 4 | 106.3 (17.3) | 74 (15.7) |
| (line) | 116V | 117V |
| 2 | 28.5 (8.5) | 12.4 (4.9) |
| (line) | 116V | 117V |
The measurement results for the Manley Reference 240 are respectable for a high-powered tube amplifier. The single set of output terminals somewhat restricts the amplifier's flexibility into lower impedance loads. Furthermore, the unweighted S/N results are unimpressive. Nevertheless, the amplifier must be rated a success on the test bench for this type of design.—Thomas J. Norton
|
|
| ||||||||||
- Log in or register to post comments


| Loudspeakers Amplification Digital Sources | Analog Sources Accessories Featured | Music Columns Retired Columns | Show Reports | Features Latest News Community | Resources Subscriptions |
 © 2024 Stereophile
AVTech Media Americas Inc., USA
All rights reserved

