| Columns Retired Columns & Blogs |
Manley Labs 440 monoblock power amplifier Measurements
Sidebar 3: Measurements
With any tube amplifier having varied setup capabilities, the decision must be made whether to present all possible measurement combinations or a selected cross-section. The latter is the only practical alternative. I did a complete set of measurements of the Manley 440 in the Triode configuration, unbalanced mode, at the standard (intermediate) feedback setting with a minimum response slope. Unless otherwise noted, the measurements below indicate those conditions.
Following its one-hour, 1/3-power preconditioning test, the Manley 440 was very hot to the touch. The Institute of High Fidelity (now incorporated into the EIA, I believe) devised this test primarily with solid-state amplifiers in mind—in which case 1/3 power usually corresponds to a worst-case heating situation. For tube amplifiers, it's less applicable, but we perform it primarily to maintain consistency and to warm-up and stabilize the amplifier. Following this warmup, the bias setting was checked and readjusted as necessary to the manufacturer's recommended setting.
The 440's voltage gain into 8 ohms was 30.9dB balanced (and virtually the same unbalanced). As expected, there was some gain increase at minimum feedback, and decrease at maximum feedback. Care should be exercised to compensate for this when comparing the audible impact of changing the feedback. The input impedance measured 144k ohms unbalanced, 114k ohms balanced. DC offset fluctuated widely due to the presence of very–low-frequency noise; I noted a maximum of 124mV. The 440 was non-inverting—a positive-going input emerging positive at the output. In the balanced mode, pin 2 is positive, pin 3 negative.
The S/N ratio, unweighted (referred to 1W into 8 ohms), was 69dB over a 22Hz–22kHz bandwidth (66.3dB from 10Hz–500kHz, unweighted, and 78.4dB A-weighted). The output impedance of the 440 varied between 0.74 ohms and 0.88 ohms, depending on frequency and load impedance (the higher values were noted, as usual, at 20kHz). This is a reasonably low value for a tube amplifier, but I'd still anticipate some effect on the frequency response with a real load.
Fig.1 shows the Manley 440's frequency response at the conditions indicated. The simulated real-world load does affect the frequency response of the amp/speaker combination (due to the amplifier's output impedance), though the deviations are within a tolerable margin (under 1dB over the audible range). Note also the slightly flatter top end in the Tetrode configuration.
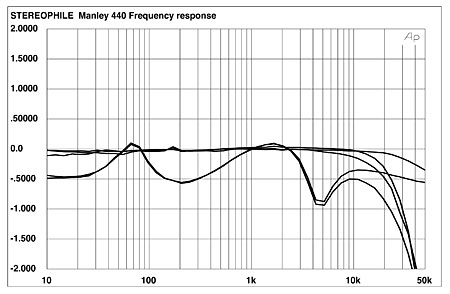
Fig.1 Manley 440, frequency response (from top to bottom at 30kHz): at 2W into 4 ohms, Tetrode mode, unbalanced; at 2W into simulated load, Tetrode mode, unbalanced; at 2W into 4 ohms, Triode mode balanced; at 2W into 4 ohms, Triode mode, unbalanced; at 2W into simulated load, Triode mode; unbalanced (right channel dashed, 0.5dB/vertical div.).
The 440's output in response to a small-signal 10kHz squarewave is shown in fig.2. This is a very good squarewave response, with only a barely visible overshoot and no ringing, plus the usual rounded leading edge found on many amplifiers (due to ultrasonic rolloff). The near-perfect 1kHz squarewave is not shown.
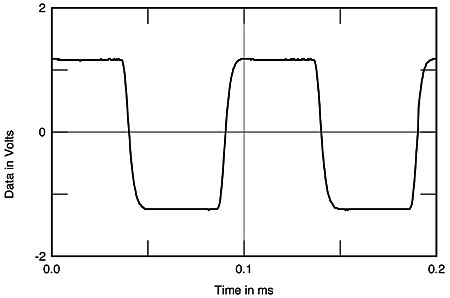
Fig.2 Manley 440, small-signal 10kHz squarewave into 8 ohms, Triode mode.
Fig.3 shows the Manley's THD+noise in Triode Mode plotted against frequency at low power levels into various loads. While the amplifier is clearly happier into a 4 or 8 ohm load than into 2 ohms, this is a very respectable set of results for a tube amplifier. The 1kHz THD+noise waveform at low power is shown in fig.4. It's primarily third-harmonic, with some higher-order components and noise. The results were similar into other load impedances.
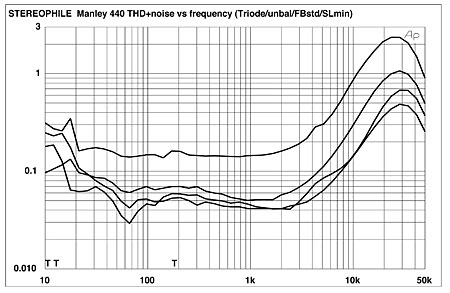
Fig.3 Manley 440, THD+noise vs frequency at (from top to bottom at 20kHz): 4W into 2 ohms, 2W into 4 ohms, 2.83V into simulated load, and 1W into 8 ohms. All in Triode mode, unbalanced, Feedback Standard, Slope Minimum.
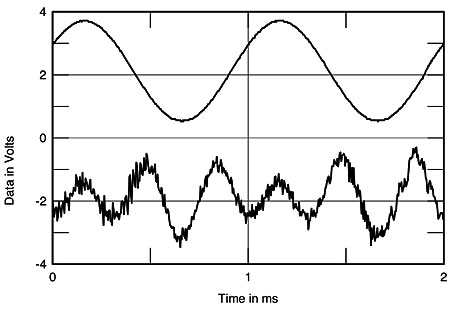
Fig.4 Manley 440, 1kHz waveform at 2W into 4 ohms (top); distortion and noise waveform with fundamental notched out (bottom, not to scale).
The distortion spectrum resulting from a 50Hz input at 112W (2/3 rated power) into 4 ohms is shown in fig.5. The relatively high, but not alarming, distortion levels are –44dB (about 0.65%) at 100Hz and –37dB (about 1.5%) at 150Hz. The result into our simulated load (not shown) was similar; the artifacts were just slightly lower.
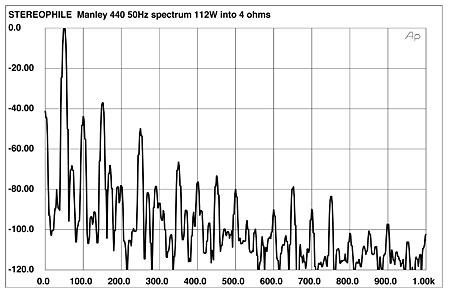
Fig.5 Manley 440, spectrum of 50Hz sinewave, DC–1kHz, at 112W into 4 ohms (linear frequency scale). Note that the third harmonic at 150Hz is the highest in level, at –37dB (about 1.5%).
Fig.6 shows the Manley's output spectrum resulting from an input of a combined 19+20kHz signal at 55W into 4 ohms—just below the level at which clipping is observed in the output waveform with this input signal. Even allowing for the 6dB crest factor with this demanding signal, this is considerably below the amp's rated power; often an amplifier can't approach more than half its rated power with this difficult combination of frequencies. Incidentally, clipping onset is quite gentle on the 440 with this input signal, visible initially as a slight rounding of the waveform. The 1kHz intermodulation artifact lies at –49dB, or about 0.35%; the distortion level at 18kHz is –32dB, or about 2.5%. The artifacts were slightly lower with the amplifier driving 8 ohms (not shown).
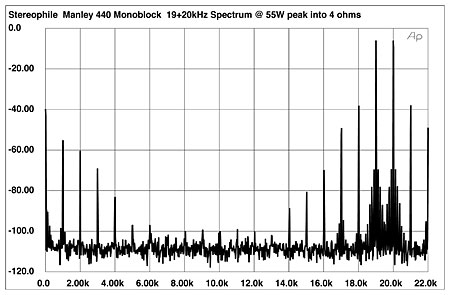
Fig.6 Manley 440, HF intermodulation spectrum, DC–22kHz, 19+20kHz at 55W into 4 ohms (linear frequency scale).
How the 440's THD+noise level varies with output power can be seen in fig.7. The output is clearly higher in Tetrode operation, though not as high as the amplifier's spec. This may have been due to our slightly low powerline voltage (under 115V) or the tube bias, which I set at the top of the recommended range.
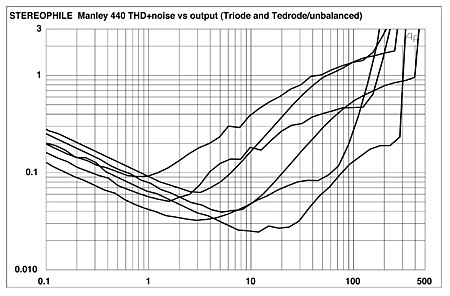
Fig.7 Manley 440, distortion (%) vs output power into (from bottom to top at 30W): 8 ohms, Tetrode mode; 8 ohms, Triode mode; 4 ohms, Tetrode mode; 4 ohms, Triode mode; 2 ohms, Tetrode mode; and 2 ohms, Triode mode.
For our purposes, discrete clipping is defined as 1% THD+noise at 1kHz. In Triode mode at the standard feedback setting, the Manley's discrete clipping points were 158W (22dBW) into 8 ohms, 210W (20.2dBW) into 4 ohms, and 156W (15.9dBW) into 2 ohms, with 112–113V AC available from the powerline during these tests.
The remaining figures show the operation of the Manley 440 at various other settings. Fig.8 shows the frequency response at 1W into 8 ohms at a variety of settings of the feedback and slope control. Note particularly that, with low feedback and high slope, the top-end rolloff will be easily audible to most listeners over most systems, clearly softening the sound. When you audition the effect of the feedback control, note that three conditions provide nearly identical frequency responses (again, don't forget the gain change at different feedback settings). These are Feedback Standard/Slope Standard, Feedback Minimum/Slope Minimum, and Feedback Maximum/Slope Maximum.
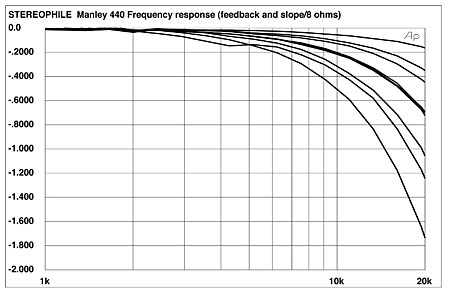
Fig.8 Manley 440, frequency response in Triode mode at 1W into 8 ohms (from top to bottom at 30kHz): Feedback Maximum, Slope Minimum; Feedback Standard, Slope Minimum; Feedback Maximum, Slope Standard; Feedback Standard/Minimum/Maximum, Slope Standard/Minimum/Maximum (three traces overlap); Feedback Standard, Slope Maximum; Feedback Minimum, Slope Standard; Feedback Minimum, Slope Maximum.
Figs.9 and 10 show the effects on THD and output power of altering feedback while keeping everything else unchanged. As expected, there are small changes, but they're not dramatic—the feedback adjustment is only 2dB per step, so the changes are about what you'd expect.
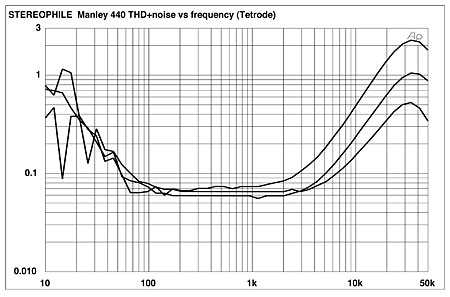
Fig.9 Manley 440, THD+noise vs frequency at 1W into 8 ohms in Triode Mode with Slope Minimum (from top to bottom at 1kHz): Feedback Minimum, Standard, Maximum.
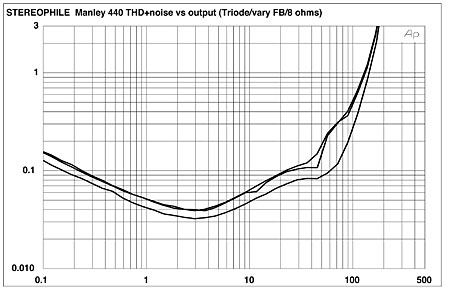
Fig.10 Manley 440, distortion (%) vs output power in Triode mode into 8 ohms with (from top to bottom at 40W): Feedback Minimum, Standard, Maximum.
Finally, fig.11 shows the THD+noise vs frequency curves for Tetrode operation. The only notable difference from the Triode results (fig.3) is in the slightly higher Triode distortion into 2 ohm loads across most of the frequency range. All in all, this is a very respectable set of measurements for a high-powered tube amp.
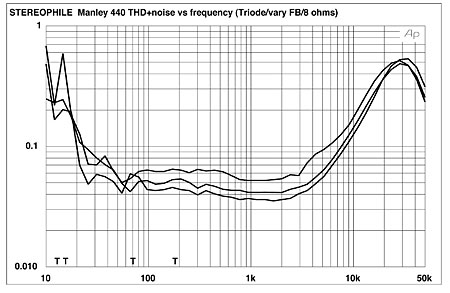
Fig.11 Manley 440, THD+noise vs frequency in Tetrode mode, at (from top to bottom at 10kHz): 4W into 2 ohms, 2W into 4 ohms, and 1W into 8 ohms.
I'm not surprised when I see various glitches and malfunctions on the test bench with a tube amplifier; with the Manley, I encountered none. But I did have a concern about its shipping integrity. The amps were shipped to Santa Fe with the tubes installed; when they arrived, one tube in one amplifier and three in the other had come loose. The glass didn't break, but the locating pins had broken off on some of the tubes. The tubes need to be better secured in shipment.—Thomas J. Norton
|
|
| ||||||||||
- Log in or register to post comments


| Loudspeakers Amplification Digital Sources | Analog Sources Accessories Featured | Music Columns Retired Columns | Show Reports | Features Latest News Community | Resources Subscriptions |
 © 2024 Stereophile
AVTech Media Americas Inc., USA
All rights reserved

