| Columns Retired Columns & Blogs |
KEF iQ9 loudspeaker Measurements
Sidebar 3: Measurements
The KEF iQ9 offered a higher-than-average voltage sensitivity at an estimated 89.7dB(B)/2.83V/m, close to the specified 91dB. Though its impedance drops to 4 ohms throughout the lower midrange (fig.1), and there is a quite demanding combination of 5 ohms magnitude and –35° electrical phase angle at 78Hz, the speaker overall is not too hard for an amplifier to drive. However, the large impedance peak in the low treble, due to the upper-frequency crossover filters, might make the speaker sound a little bright with tube amplifiers having a high source impedance.
The traces in fig.1 are free from the small wrinkles that would indicate the presence of cabinet resonances. Investigating the enclosure wall's vibrational behavior with a simple accelerometer revealed that some high-level modes were present on the sides (fig.2), but these are probably high enough in frequency to have no audible consequences.
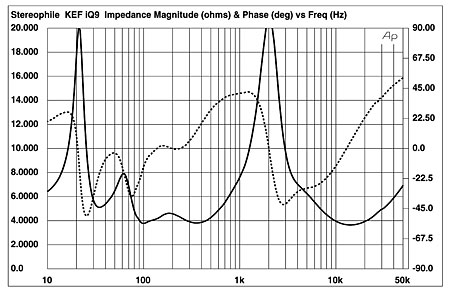
Fig.1 KEF iQ9, electrical impedance (solid) and phase (dashed). (2 ohms/vertical div.)
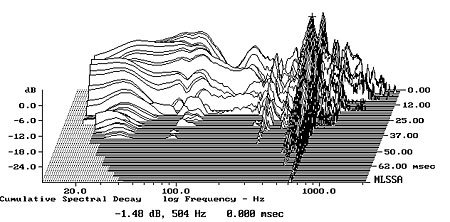
Fig.2 KEF iQ9, cumulative spectral-decay plot calculated from the output of an accelerometer fastened to the center of the cabinet's side panel 12" from the top (MLS driving voltage to speaker, 7.55V; measurement bandwidth, 2kHz).
The saddle at 35Hz in the impedance magnitude trace indicates that this is the tuning frequency of the twin ports. In fact, each of the woofers is reflex-loaded by its own port, with the lower woofer tuned very slightly lower in frequency than the upper woofer. The red trace in fig.3 shows the sum of the two woofer outputs; they cover quite a narrow bandpass, rolling out above 125Hz. The green trace in fig.3 is the sum of the port outputs, scaled in proportion to the square root of the total radiating area.
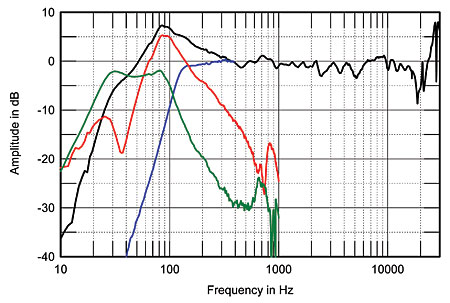
Fig.3 KEF iQ9, anechoic response on tweeter axis at 50", averaged across 30° horizontal window and corrected for microphone response (black), with the nearfield responses of midrange unit (blue), woofers (red), and ports (green), and the complex sum of these nearfield responses, taking into account acoustic phase and distance from the nominal farfield point (black).
Normally, the port output would be a bandpass centered on the tuning frequency. However, the response of the iQ9's ports extends more than an octave higher than this frequency. This, coupled with the fact that there are two woofers but only one midrange unit (blue trace), results in an apparent midbass boost when the outputs of all five radiators are summed, taking acoustical phase into account (black trace). Around 3dB of this boost will be due to the nearfield-measurement technique used to measure the speaker's low-frequency behavior, but the iQ9's output appears to be exaggerated in this region. I note that Bob Reina did complain about "midbass warmth."
Higher in frequency, BJR was taken by the KEF's midrange, and while fig.3 indicates an impressively flat farfield balance, the upper midrange is slightly boosted compared with the ranges immediately above and below it, which will aid the impression of detail. Though there are some small dips and peaks in the treble, these are much less severe than I noted with earlier incarnations of KEF's UniQ dual driver.
The iQ9's plot of lateral dispersion on the tweeter axis (fig.4), in which only the off-axis changes in response are shown, reveals a slight flare at the bottom of the tweeter's passband that might add some brightness in underdamped rooms. The dispersion is wide at the top of the audioband, with the off-axis ridges actually due to on-axis suckouts filling in to the speaker's sides. However, there is a persistent lack of off-axis energy in the 15kHz region. The KEF offers wide dispersion in the vertical plane (fig.5), meaning that the listening axis will be relatively uncritical.
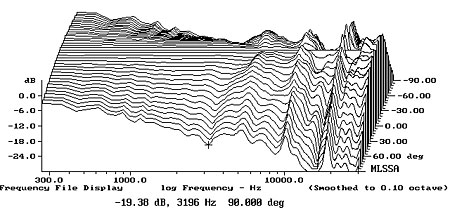
Fig.4 KEF iQ9, lateral response family at 50", normalized to response on tweeter axis, from back to front: differences in response 90–5° off axis, reference response, differences in response 5–90° off axis.
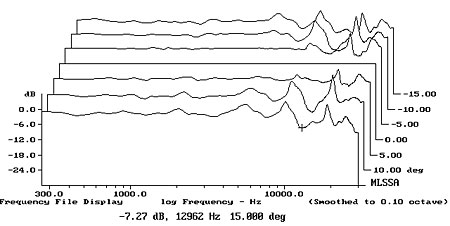
Fig.5 KEF iQ9, vertical response family at 50", normalized to response on tweeter axis, from back to front: differences in response 15–5° above axis, reference response, differences in response 5–15° below axis.
The iQ9's step response (fig.6) indicates that the tweeter and midrange unit are connected in inverted acoustic polarity, the woofers in positive polarity. Plotting the individual steps (not shown) reveals that the onset of the woofers' step coincides with the rise above the time axis of the midrange unit's step, this correlating with the good frequency-domain integration seen between these units. The KEF's farfield waterfall plot (fig.7) is fairly clean, though a couple of low-level ridges of delayed energy can be seen in the upper midrange.
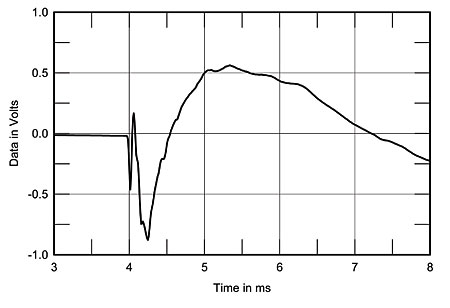
Fig.6 KEF iQ9, step response on tweeter axis at 50" (5ms time window, 30kHz bandwidth).
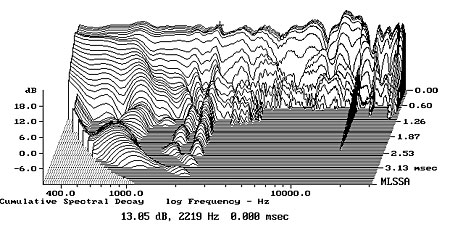
Fig.7 KEF iQ9, cumulative spectral-decay plot at 50" (0.15ms risetime).
Overall, its heavy midbass aside, the KEF iQ9 offers good measured performance.—John Atkinson
|
|
| ||||||||||
- Log in or register to post comments


| Loudspeakers Amplification Digital Sources | Analog Sources Accessories Featured | Music Columns Retired Columns | Show Reports | Features Latest News Community | Resources Subscriptions |
 © 2024 Stereophile
AVTech Media Americas Inc., USA
All rights reserved

