1995 Measurements Following the 1/3-power, one-hour preconditioning test, the Rowland Model 2's heatsinks were very warm, but not hot, to the touch. The Model 2 measurements here are all for balanced operation, and, unless otherwise specified, the amplifier was in its high-input-impedance mode. In this configuration, the input impedance was 49.4k ohms (it measured 718 ohms in the low-input-impedance mode). Its output impedance was under 0.02 ohms at 20Hz and 1kHz, increasing to a maximum of 0.028 ohms at 20kHz. The voltage gain of the Model 2 was 26dB into 8 ohms (32dB in the high-gain setting, 24.7dB in the low-gain, low-input-impedance configuration). Its DC offset was unmeasurable in the left channel and 0.3mV in the right. Signal/noise (unweighted, ref. 1W into 8 ohms) measured 87.3dB.
The Model 2 is non-inverting using the unbalanced adapters furnished by Rowland. In the normal balanced mode, pin 3 is positive, pin 2 negative—opposite from the most common US configuration. Fig.1 shows the frequency response of the Rowland Model 2. The response shown is for an 8 ohm load; the 4 ohm response (not shown) was identical. (As our new, simulated loudspeaker load was not available at the time the Rowland 2 was measured, no results with it appear here.) The 1kHz squarewave response, not shown, was virtually perfect. The 10kHz squarewave shown in fig.2 is an excellent result, with no overshoot and only a slightly reduced risetime and a little rounding at the leading edge—consistent with a rolloff above the audible range. The crosstalk of fig.3 is excellent, with tight matching between the two channels. 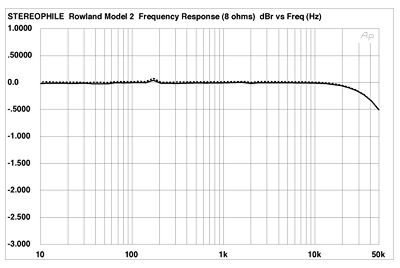 Fig.1 Rowland Model 2, frequency response at 1W into 8 ohms (0.5dB/vertical div., right channel dashed).
  Fig.2 Rowland Model 2, small-signal 10kHz squarewave into resistive load.
  Fig.3 Rowland Model 2, crosstalk: R-L (bottom at 80Hz, top at 50kHz), L-R (10dB/vertical div.). The THD+noise vs frequency curves are plotted in fig.4. The distortion is generally low, though somewhat higher in the right channel than in the left. The distortion also rises at higher frequencies—a very common result. The 1kHz distortion waveform into 2 ohms (fig.5) is heavily third-harmonic plus noise, as well as a proportion of higher harmonics giving rise to the spiky spuriae waveform (lower trace). The 8 and 4 ohm results were similar and are not shown.
 Fig.4 Rowland Model 2, THD+noise (%) vs frequency at (from bottom to top at 2kHz): 1W into 8 ohms (left), 2W into 4 ohms (left), 4W into 2 ohms (left), 1W into 8 ohms (right), 2W into 4 ohms (right).
  Fig.5 Rowland Model 2, 1kHz waveform at 15W into 2 ohms (top); distortion and noise waveform with fundamental notched out (bottom, not to scale). The spectrum of the Model 2's output reproducing 50Hz at 100W into 4 ohms is shown in fig.6. Only the third harmonic—at -84dB, or about 0.0065%—is greater than -90dB; a superb result. Fig.7 shows the output spectrum resulting from a combined 19+20kHz signal. The power output here is 92W into 4 ohms—the closest I could approach 2/3 rated power before visible signs of clipping appeared. Only the 18kHz and 21kHz intermodulation products are "significant," at about -71dB, or 0.025%. The result into 8 ohms (at 50W), not shown, is even better than this already superb 4 ohm measurement.
 Fig.6 Rowland Model 2, spectrum of 50Hz sinewave, DC-1kHz, at 100W into 4 ohms (linear frequency scale).
  Fig.7 Rowland Model 2, HF intermodulation spectrum, DC-22kHz, 19+20kHz at 92W into 4 ohms (linear frequency scale). The 1kHz, THD+noise percentage vs output power curve is shown in fig.8. Note the premature end to the result into a 2 ohm load. The Model 2 was not happy delivering high power into 2 ohms. On this particular measurement, it blew a fuse at 120W output, before the plot was completed. Similarly, Table 1 below, for the discrete clipping levels, does not show values for the 2 and 4 ohm conditions with one channel driven. I blew fuses several times as I attempted to take these readings. Note that the clipping point, defined as 1% THD+N, is well above the specified power rating.
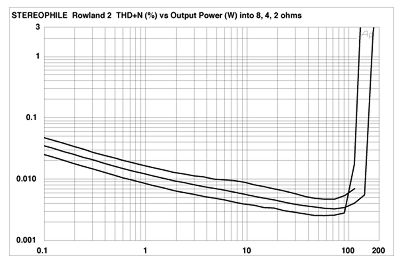 Fig.8 Rowland Model 2, distortion (%) vs output power (W) into (from bottom to top at 10W): 8 ohms, 4 ohms, and 2 ohms. The Model 2 performed very well on the test bench, though it does appear to have limitations into a 2 ohm load, suggesting care in matching it to loudspeakers that have consistent impedances under 3 ohms. Such loudspeakers, fortunately, are rare.—Thomas J. Norton
Fig.1 Rowland Model 2, frequency response at 1W into 8 ohms (0.5dB/vertical div., right channel dashed). Fig.2 Rowland Model 2, small-signal 10kHz squarewave into resistive load. Fig.3 Rowland Model 2, crosstalk: R-L (bottom at 80Hz, top at 50kHz), L-R (10dB/vertical div.). The THD+noise vs frequency curves are plotted in fig.4. The distortion is generally low, though somewhat higher in the right channel than in the left. The distortion also rises at higher frequencies—a very common result. The 1kHz distortion waveform into 2 ohms (fig.5) is heavily third-harmonic plus noise, as well as a proportion of higher harmonics giving rise to the spiky spuriae waveform (lower trace). The 8 and 4 ohm results were similar and are not shown. Fig.4 Rowland Model 2, THD+noise (%) vs frequency at (from bottom to top at 2kHz): 1W into 8 ohms (left), 2W into 4 ohms (left), 4W into 2 ohms (left), 1W into 8 ohms (right), 2W into 4 ohms (right). Fig.5 Rowland Model 2, 1kHz waveform at 15W into 2 ohms (top); distortion and noise waveform with fundamental notched out (bottom, not to scale). The spectrum of the Model 2's output reproducing 50Hz at 100W into 4 ohms is shown in fig.6. Only the third harmonic—at -84dB, or about 0.0065%—is greater than -90dB; a superb result. Fig.7 shows the output spectrum resulting from a combined 19+20kHz signal. The power output here is 92W into 4 ohms—the closest I could approach 2/3 rated power before visible signs of clipping appeared. Only the 18kHz and 21kHz intermodulation products are "significant," at about -71dB, or 0.025%. The result into 8 ohms (at 50W), not shown, is even better than this already superb 4 ohm measurement. Fig.6 Rowland Model 2, spectrum of 50Hz sinewave, DC-1kHz, at 100W into 4 ohms (linear frequency scale). Fig.7 Rowland Model 2, HF intermodulation spectrum, DC-22kHz, 19+20kHz at 92W into 4 ohms (linear frequency scale). The 1kHz, THD+noise percentage vs output power curve is shown in fig.8. Note the premature end to the result into a 2 ohm load. The Model 2 was not happy delivering high power into 2 ohms. On this particular measurement, it blew a fuse at 120W output, before the plot was completed. Similarly, Table 1 below, for the discrete clipping levels, does not show values for the 2 and 4 ohm conditions with one channel driven. I blew fuses several times as I attempted to take these readings. Note that the clipping point, defined as 1% THD+N, is well above the specified power rating. Fig.8 Rowland Model 2, distortion (%) vs output power (W) into (from bottom to top at 10W): 8 ohms, 4 ohms, and 2 ohms. The Model 2 performed very well on the test bench, though it does appear to have limitations into a 2 ohm load, suggesting care in matching it to loudspeakers that have consistent impedances under 3 ohms. Such loudspeakers, fortunately, are rare.—Thomas J. Norton