| Columns Retired Columns & Blogs |
HeadRoom Desktop D/A headphone amplifier Measurements
Sidebar 3: Measurements
Looking first at the HeadRoom Desktop's performance in the analog domain, its input impedance was very high, at approximately 100k ohms across the audioband. It didn't invert signal polarity and the output impedance was a very low 1.6 ohms at all frequencies, from both the headphone jacks and the rear-panel RCA jacks. (This figure includes the series resistance of 6' of interconnect.) The maximum voltage gain at 1kHz depended on the setting of the front-panel gain switch. With this in the central, Low position, the Desktop attenuated the input signal by 8.1dB. With the switch in the bottom, Medium position, the maximum gain was a modest 7.3dB. And in the top, High position, the maximum gain was 18.7dB.
With the Brightness switch set to Off, the frequency response was flat to well above the audioband (fig.1, bottom pair of traces), with the ultrasonic rolloff somewhat dependent on the volume-control position. With the volume control at its maximum, the –3dB point lay at 180kHz; with it set to 12:00, the bandwidth increased slightly but inconsequentially, to around 220kHz. The other traces in fig.1 show the effect of the Brightness switch set to Filter 2 (top trace) and Filter 1 (middle). Both give a maximum boost of 2.5dB in the top two audio octaves, but Filter 2 extends the boost an octave lower in frequency. I haven't shown the effect of HeadRoom's Crossfeed circuit, as I examined that in depth in my review of HeadRoom's original Supreme amplifier.
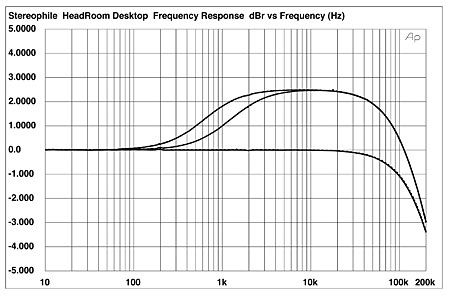
Fig.1 HeadRoom Desktop, frequency response into 100k ohms via analog input at 1V (bottom), with Brightness switch set to Filter 1 (middle) and Filter 2 (top). (Right channel dashed, 1dB/vertical div.)
Channel separation was better than 85dB in both directions below 1kHz (fig.2), but decreased with increasing frequency due to capacitive coupling. Background noise levels were very low. However, placing the Desktop atop the power supply is not a good idea, as this injects 60Hz and 180Hz spuriae. I got the lowest noise with the power supply to the side and about 2' away.
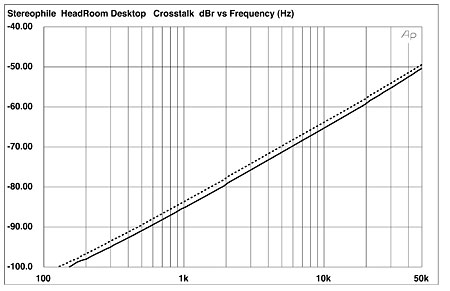
Fig.2 HeadRoom Desktop, channel separation via analog input (R–L crosstalk dashed).
The Desktop's maximum output level, regardless of the Gain switch setting, was the same from both headphone jacks and the rear-panel RCAs: around 9.5V. This was into loads above 500 ohms; it dropped slightly into 50 ohms, to just under 9V. Fig.3 shows how the THD+noise percentage changes with increasing output voltage and decreasing load impedance. Into loads ranging from 100k ohms to 10k ohms, typical of the range of power-amplifier input impedances that the Desktop will see when used as a preamplifier, the THD+N drops with increasingly level, almost to the clipping point, indicating that it comprises almost all noise, with the actual harmonic components buried within that noise (fig.4). Into lower impedances, from 5k to 500 ohms, the THD+N percentage in fig.3 starts to rise a little above its vanishingly low level above 3V, while into loads ranging from 100 ohms to 50 ohms, typical of worst-case headphones, there is a large increase in THD even at levels below 1V.
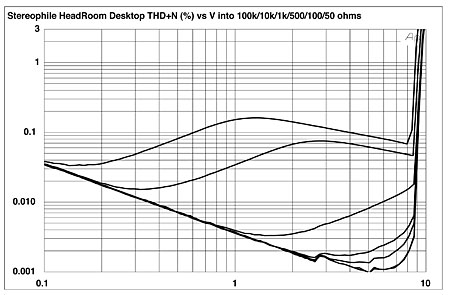
Fig.3 HeadRoom Desktop, distortion (%)vs 1kHz output voltage into (from bottom to top at 8V): 100k, 10k, 5k, 1k, 500, 100, 50 ohms.
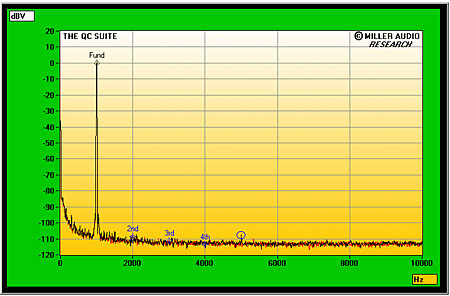
Fig.4 HeadRoom Desktop, spectrum of 1kHz sinewave at 1V into 8k ohms, DC–10kHz (linear frequency scale).
This can also be seen in fig.5, which plots the THD+N percentage against frequency at 3V—the amplifier is clearly working hard into the lower impedances. However, as shown by figs.6 and 7, the rise in distortion into lower impedances is mainly due to the subjectively innocuous second harmonic. Intermodulation distortion was virtually nonexistent into 100k ohms (fig.8). Though the level of the 1kHz difference component rose into 150 ohms (fig.9), this was still relatively low in absolute terms, especially considering the high output voltage (3V) at which this graph was taken. The headphone outputs and the RCA outputs behaved identically in this respect.
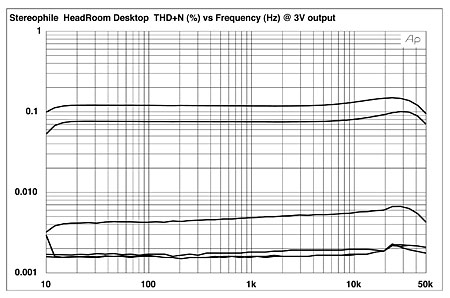
Fig.5 HeadRoom Desktop, THD+N (%)vs frequency at 3V into (from bottom to top): 100k, 10k, 1k, 500, 100, 50 ohms.
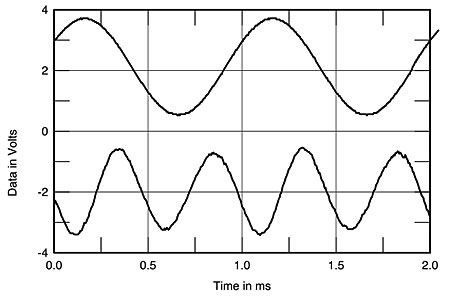
Fig.6 HeadRoom Desktop, 1kHz waveform at 1V into 150 ohms (top), 0.019% THD+N; distortion and noise waveform with fundamental notched out (bottom, not to scale).
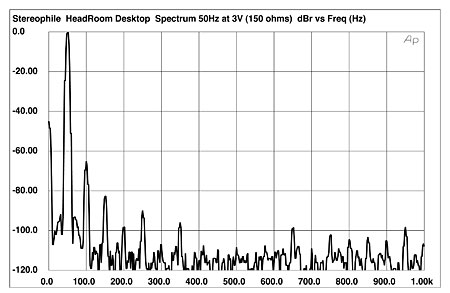
Fig.7 HeadRoom Desktop, spectrum of 50Hz sinewave, DC–1kHz, at 3V into 150 ohms (linear frequency scale).
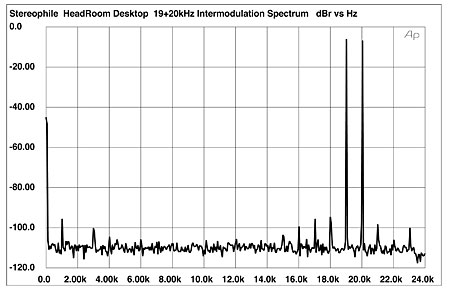
Fig.8 HeadRoom Desktop, HF intermodulation spectrum, 19+20kHz at 3V peak into 100k ohms, DC–24kHz (linear frequency scale).
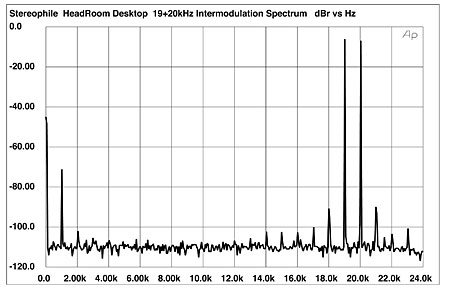
Fig.9 HeadRoom Desktop, HF intermodulation spectrum, 19+20kHz at 3V peak into 150 ohms, DC–24kHz (linear frequency scale).
Fed digital data representing a 1kHz tone at 0dBFS and with its volume control at its maximum position, the HeadRoom Desktop had a maximum output of 950mV in Low gain mode and 5.57V in Medium gain mode. It wasn't possible to use the maximum volume in High gain mode, because by then the Desktop was well into clipping with a 0dBFS signal. Backing off the volume control five clicks eliminated the clipping, with an a resultant output level of 8.74V, way higher than ever will be required in real life. The D/A section didn't invert absolute polarity, and successfully locked on to datastreams with sample rates of up to 96kHz.
The Desktop's frequency response when fed 96kHz-sampled data rolled off gently above the audioband, reaching –2dB at 40kHz, above which it dropped very quickly (fig.10, top pair of traces). The Desktop correctly recognized the emphasis flag when fed pre-emphasized CD data (bottom traces). Channel separation with the unit fed digital data was identical to that for the analog inputs.
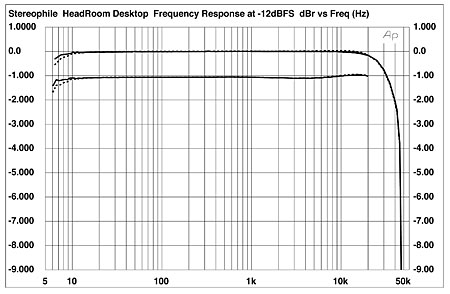
Fig.10 HeadRoom Desktop, digital input, frequency response at –12dBS into 100k ohms, 96kHz-sampled data (top), CD response with de-emphasis (bottom) (right channel dashed, 1dB/vertical div.).
Fig.11 shows a 1/3-octave spectral analysis of the Desktop's output as it decoded dithered 16- and 24-bit data representing a 1kHz tone at –90dBFS, as well as dithered 24-bit data representing a tone at –120dBFS. There are no spuriae evident in the spectra, and the increase in word length drops the noise floor by more than 15dB, suggesting an ultimate resolution approaching 19 bits, which is superb behavior, particularly at lower frequencies. Repeating this test with 24-bit digital silence (not shown) showed a rising noise floor above the audioband due to the DAC's noiseshaping, but this reached a still-low –85dB at 200kHz.
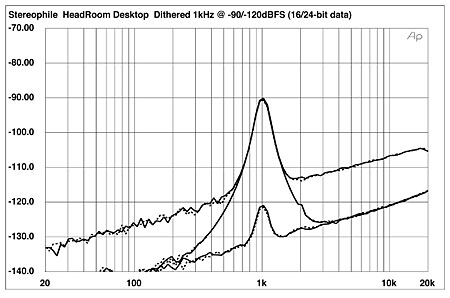
Fig.11 HeadRoom Desktop, 1/3-octave spectrum with noise and spuriae, of (from top to bottom): dithered 1kHz tone at –90dBFS, 16-bit and 24-bit data, dithered 1kHz tone at –120dBFS, 24-bit data (right channel dashed).
The fade-to-noise test with 16-bit data (fig.12) is dominated by the dither noise used to encode the signal. Repeating the test with 24-bit data gave almost zero linearity error down to –120dBFS, and –1dB at that level, but I couldn't get consistent results below that. The Desktop's reproduction of an undithered 1kHz sinewave at exactly –90.31dBFS (fig.13) was essentially perfect, with excellent waveform symmetry and low noise. Increasing the word length to 24 bits gave a superb sinewave (fig.14).
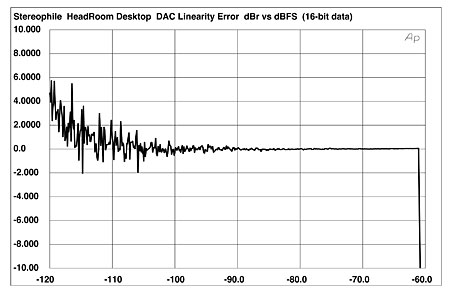
Fig.12 HeadRoom Desktop, left-channel departure from linearity, 16-bit data (2dB/vertical div.).
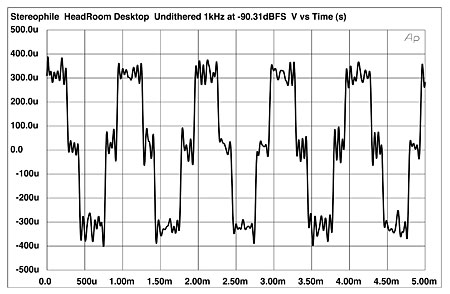
Fig.13 HeadRoom Desktop, waveform of undithered 1kHz sinewave at –90.31dBFS, 16-bit data.
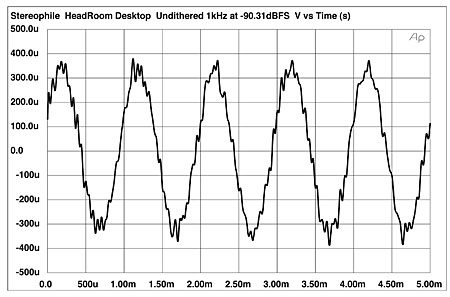
Fig.14 HeadRoom Desktop, waveform of undithered 1kHz sinewave at –90.31dBFS, 24-bit data.
Finally, the Desktop was very good at rejecting word-clock jitter. Feeding it 16-bit data from my PC via a TosLink connection gave just 236 picoseconds peak–peak of jitter sidebands (fig.15). The highest-level spuriae lay at ±15.6Hz (purple "1" markers), ±1363Hz (purple "9"), and ±1384Hz (purple "10"). Data-related sidebands (red numeric markers) were all low in level. Changing to an electrical S/PDIF connection raised the jitter level to a still-low 266ps, but I had to use the HeadRoom power supply's Ground Lift switch to avoid injecting 120Hz hum into the spectrum.
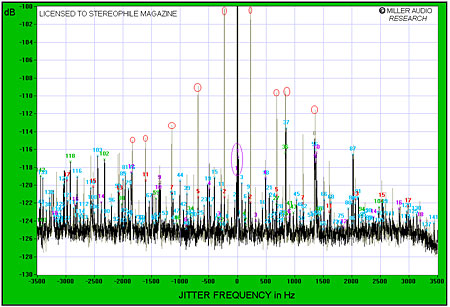
Fig.15 HeadRoom Desktop, high-resolution jitter spectrum of analog output signal (11.025kHz at –6dBFS sampled at 44.1kHz with LSB toggled at 229Hz), 16-bit data from PC via TosLink connection. Center frequency of trace, 11.025kHz; frequency range, ±3.5kHz. (Grayed-out trace is with 16-bit data fed to Desktop from Apple PowerBook via USB input.)
Wes Phillips reported getting good sound using the USB input from his computer. This gave the same maximum output level as the conventional digital inputs, but did raise the jitter level to 682.5ps, mainly due to the introduction of some high-level sidebands at the data-related frequencies of ±230Hz and its harmonics (grayed-out trace in fig.15, red-circled spectral lines). The central peak in this graph was also slightly wider than with the S/PDIF connection, implying the presence of some very-low-frequency random jitter. Even so, this was very much better jitter rejection than from any other product I have tested using a USB data interface.
HeadRoom's Desktop offers excellent measurements in both the analog and digital domains. Modern inexpensive digital products offer measured performance that rival what you would have had to pay $10k for 10 years ago.—John Atkinson
NEXT: Follow-Up, November 2006 »
|
|
| ||||||||||
- Log in or register to post comments


| Loudspeakers Amplification Digital Sources | Analog Sources Accessories Featured | Music Columns Retired Columns | Show Reports | Features Latest News Community | Resources Subscriptions |
 © 2024 Stereophile
AVTech Media Americas Inc., USA
All rights reserved

