| Columns Retired Columns & Blogs |
Harbeth HL-P3 loudspeaker 2007 Measurements
Sidebar: 2007 Measurements
The HL-P3ES-2 was slightly more sensitive than the LS3/5a, at an estimated 83.5dB(B)/2.83V/m, close to the specified 83dB. However, its plot of impedance magnitude and electrical phase angle against frequency (fig.1) revealed it to be a more demanding load, with a minimum value of 3.9 ohms at 165Hz and a combination of 6 ohms and –42° phase angle at 100Hz. (The specification describes it as a nominal 6 ohm load.) The peak of 21.5 ohms at 63.5Hz indicates that the tuning frequency of the sealed enclosure is significantly lower than the Stirling LS3/5a's 81Hz. The Harbeth's cabinet is also more lively than the Stirling's, with a strong mode present at 380Hz on the sidewalls. The original HL-P3 I reviewed in 1993 behaved in a very similar manner, though the primary resonance was a little lower in frequency, at 340Hz.
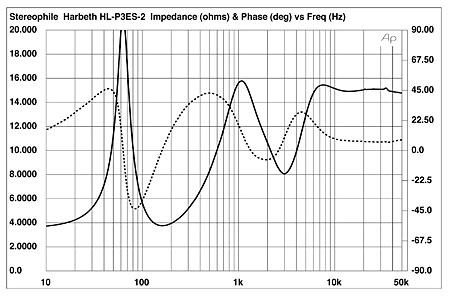
Fig.1 Harbeth HL-P3ES-2, electrical impedance (solid) and phase (dashed). (2 ohms/vertical div.)
The red and blue traces in fig.2 show, respectively, the farfield responses of the tweeter and woofer. The crossover filter slopes appear to be third-order, 18dB/octave, and the two units are well behaved both in and out of their passbands. The black trace in fig.2 is the speaker's overall response averaged across a 30° horizontal window centered on the tweeter axis, spliced at 300Hz to the woofer's nearfield response. It is commendably flat, though there is a slight bump in the crossover region, due to the drivers overlapping a little. The midrange is very slightly recessed, and though the upper-bass bump will be in part an artifact of the nearfield measurement technique, the HL-P3ES-2, like the LS3/5a, tries to give the listener the illusion that the speaker has more bass extension than it actually does.

Fig.2 Harbeth HL-P3ES-2, anechoic response on drive-unit axis at 50", averaged across 30° horizontal window and corrected for microphone response (black trace), with the individual responses of the tweeter (red) and woofer (blue), along with the nearfield response of the woofer plotted below 300Hz (black).
For reference, in fig.3 I plotted the averaged response on the tweeter axis of the 2006 sample of the HL-P3ES-2 (red trace) against that of the 1993 sample of the original HL-P3 (blue). To my surprise, they overlaid one another very closely. Both are superbly flat, though the newer speaker has very slightly less top-octave energy and its low-treble bump is a half-octave higher in frequency (the actual crossover frequencies seem to be identical). Apparently, the newer speaker also has slightly more midbass extension.

Fig.3 Harbeth HL-P3ES-2, anechoic response on drive-unit axis at 50", averaged across 30° horizontal window and corrected for microphone response (red trace), with the similarly derived response of a 1993 HL-P3 sample (blue).
In the vertical plane, the plot of the Harbeth's radiation pattern (fig.4) indicated that a large suckout developed in the crossover region above the tweeter axis, leaving the mid-high-treble regions exposed. Stands sufficiently high to place the listener's ears level with the speaker's tweeter should be regarded as mandatory. The HL-P3ES-2's lateral dispersion plot (fig.5) revealed a wide, well-controlled radiation pattern that no doubt contributed to its accurate stable imaging. A slight flare at the base of the tweeter's passband might make the speaker sound a tad bright in lively rooms.

Fig.4 Harbeth HL-P3ES-2, vertical response family at 50", normalized to response on tweeter axis, from back to front: differences in response 45–5° above axis, reference response, differences in response 5–45° below axis.

Fig.5 Harbeth HL-P3ES-2, lateral response family at 50", normalized to response on tweeter axis, from back to front: differences in response 90–5° off-axis, reference response, differences in response 5–90° off-axis.
Even in my room, which is acoustically well damped, the Harbeths' spatially averaged response had a touch of excess energy between 3 and 6kHz (fig.6). Other than that, the usual boundary cancellations in the lower midrange, and the small peak at 32Hz that has not been eliminated by the spatial averaging, the HL-P3ES-2 produced an even, well-balanced room response.

Fig.6 Harbeth HL-P3ES-2, spatially averaged, 1/6-octave response in JA's listening room.
In the time domain, the HL-P3ES-2's step response (fig.7) indicated that, like the LS3/5a's, its tweeter is connected in inverted acoustic polarity, its woofer in positive polarity, and the high- and low-frequency steps hand off to one another coherently. This correlates with the good frequency-domain integration of the two units' outputs seen in fig.2. Other than a slight discontinuity at the top of the woofer's passband similar to that seen in the Stirling V2's waterfall plot, the Harbeth's cumulative spectral-decay plot was superbly clean (fig.8).—John Atkinson

Fig.7 Harbeth HL-P3ES-2, step response on tweeter axis at 50" (5ms time window, 30kHz bandwidth).

Fig.8 Harbeth HL-P3ES-2, cumulative spectral-decay plot at 50" (0.15ms risetime).
|
| ||||||||||
- Log in or register to post comments


| Loudspeakers Amplification Digital Sources | Analog Sources Accessories Featured | Music Columns Retired Columns | Show Reports | Features Latest News Community | Resources Subscriptions |
 © 2024 Stereophile
AVTech Media Americas Inc., USA
All rights reserved

