| Columns Retired Columns & Blogs |
Harbeth BBC LS5/12A loudspeaker Measurements
Sidebar 3: Measurements
Footnote 1: Trevor Butler, in Hi-Fi News & Record Review, December '93, Vol.38 No.12, p.39.
Almost all the measurements accompanying this review were made with the DRA Labs MLSSA system, a full-length card that fits into a PC. This generates a pseudo-random noise signal which is picked up by a B&K 4006 microphone, calibrated to be flat on-axis at the approximate measuring distance I use. The host computer then compares the microphone's output with the drive signal it sent out to the loudspeaker and, by performing a cross-correlation operation, calculates the speaker's impulse response. By windowing out reflections of the speaker's output from room boundaries, a good estimate of its anechoic amplitude in the midrange and above can be made by performing a Fast Fourier Transform operation on that impulse response. To assess low-frequency performance, I repeat the procedure with the microphone almost touching the woofer and port opening; this, too, allows the room to be almost entirely removed from the equation. To look at the speaker's horizontal and vertical dispersion, I take a series of measurements, rotating the speaker a predetermined angle between each reading using the Italian Outline computer-controlled speaker stand/turntable.
The impedance magnitude and phase were measured using the Audio Precision System One. Though it drops to 6.4 ohms in the upper bass, the LS5/12A's impedance plot (fig.1) reveals the speaker to be relatively easy to drive. This is a good thing, as its estimated sensitivity, though basically to specification at 81.5B/W/m (B-weighted), is very low, 1dB below even the LS3/5A. The port is tuned to a highish 72Hz, as revealed by the saddle in the magnitude trace at that frequency. As expected from the small, rigid cabinet construction, no wrinkles due to panel resonances can be seen in fig.1.

Fig.1 Harbeth LS5/12A, electrical impedance (solid) and phase (dashed) (2 ohms/vertical div.).
The Harbeth's individual drive-unit and port responses are shown in fig.2. The port's output peaks at 80Hz rather than the expected 72Hz, the minimum-motion point of the woofer cone. Higher in frequency, the woofer peaks up at 2.4kHz before rolling out sharply. The tweeter actually seems to come in a little early, though it doesn't actually plateau until 4kHz.
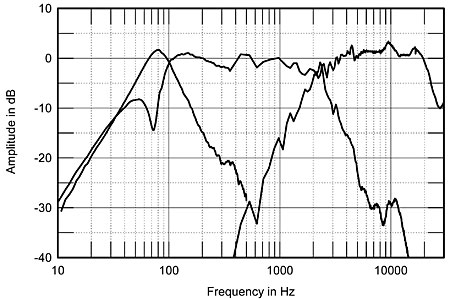
Fig.2 Harbeth LS5/12A, acoustic crossover on tweeter axis at 50" corrected for microphone response, with nearfield woofer and port responses plotted below 312Hz and 500Hz, respectively.
The sum of these responses can be seen in fig.3, which shows the response averaged across a 30° horizontal window on the tweeter axis spliced to the complex sum—magnitude and phase—of the woofer and port outputs. The bass peaks up sharply at 100Hz before rolling out at a steep 24dB/octave. Higher in frequency, the general response trend is pretty flat, but, as implied in fig.2, the crossover from the woofer to the tweeter is suboptimal in that the response peaks up where the drive-units overlap.
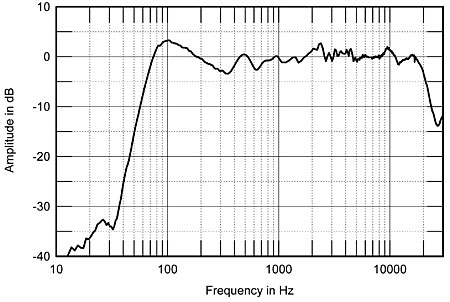
Fig.3 Harbeth LS5/12A, anechoic response on tweeter axis at 50" averaged across 30° horizontal window and corrected for microphone response, with complex sum of nearfield woofer and port responses below 300Hz.
As might be expected from the woofer's small radiating diameter and the narrow baffle, the LS5/12A's lateral dispersion behavior (fig.4) is excellent. The manner in which the high frequencies roll off to the speaker's side is even and well-controlled, though the top octave rolls off a little prematurely. Vertically (fig.5), the response is maintained to 5° above the tweeter and 10° below, with crossover notches developing at more extreme angles. Given the on-axis peak at 2.4kHz, it would probably be best to listen with this Harbeth on stands high enough that you end up sitting on the woofer axis. Alternatively, if you placed it on a stand low enough that, when seated, you could see the top of the enclosure, this would pull down the direct energy in the crossover region to give a more neutral mid-treble balance.

Fig.4 Harbeth LS5/12A, horizontal response family at 50", normalized to response on tweeter axis, from back to front: differences in response 90°–5° off-axis; reference response; differences in response 5°–90° off-axis.

Fig.5 Harbeth LS5/12A, vertical response family at 50", normalized to response on tweeter axis, from back to front: differences in response 45°–5° above tweeter axis; reference response; differences in response 5°–45° below tweeter axis.
In my listening room, however, the Harbeths proved relentlessly bright, which can be seen in the spatially averaged room response (fig.6) as the energy excess between 2kHz and 6kHz. (For the in-room spectral analysis, I average six measurements at each of 10 separate microphone positions for left and right speakers individually, giving a total of 120 original spectra. These are then averaged to give a curve which in my room has proved to give a good correlation with a loudspeaker's perceived balance. I use an Audio Control Industrial SA-3050A spectrum analyzer with its own microphone, which acts as a check on the MLSSA measurements made with the B&K mike. I also used the Goldline DSP-30 automated spectrum analyzer, which is currently under review.)
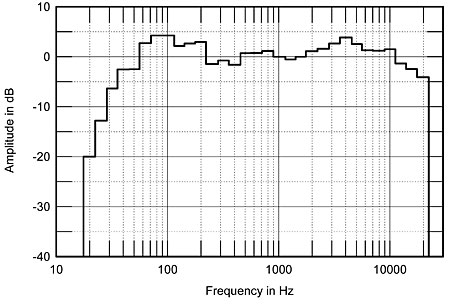
Fig.6 Harbeth LS5/12A, spatially averaged 1/3-octave response in JA's listening room.
Also as expected from my auditioning, the low frequencies in this graph are also peaked up. Early reports on the LS5/12A were that it was bright, but some modifications had been performed to alleviate this (footnote 1). So why did I still find it a problem? Note that, probably due to the tweeter's limited directivity in the top octave, this graph is a little rolled-off in this region. This will have the subjective effect of accentuating any mid-treble boost. I also wonder if the BBC's modification had involved adjusting the tweeter's level when the real culprits are a problem at the top of the woofer's response and the overlap in the drive-unit passbands, as shown in figs.2 and 3.
In fact, there is a clear correlation between the Harbeth's perceived tonal balance and the trace in fig.6. I have to say to any loudspeaker designer that this kind of in-room response is almost guaranteed to mark a speaker down in my listening tests. Yes, it does bring detail forward in the mix, but gets too fatiguing too quickly, in my experience, for any kind of long-term listening pleasure. As to why the BBC's "Golden Ears" preferred this type of balance...
In the time domain, the impulse response (fig.7) is typical of a design using high-order crossover filters, while the associated step response (fig.8) indicates that the two drivers are connected in the same, positive acoustic polarity, with the tweeter's output slightly leading that of the woofer. The waterfall, or cumulative spectral-decay, plot (fig.9) calculated from the impulse response is very clean overall, but is marred by a significant resonant ridge at 2.4kHz, this associated with the peak in the woofer's response at this frequency. A second resonant ridge can also be seen an octave higher. These resonant modes will both contribute to the speaker sounding bright and make its balance rather "hard," overall. (Incidentally, ignore the ridge just below 16kHz in this graph, which is due to the computer's monitor's screen.)
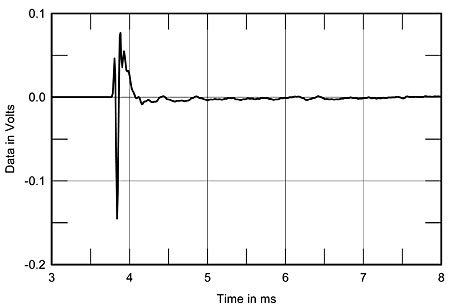
Fig.7 Harbeth LS5/12A, impulse response on tweeter axis at 50" (5ms time window, 30kHz bandwidth).

Fig.8 Harbeth LS5/12A, step response on tweeter axis at 50" (5ms time window, 30kHz bandwidth).
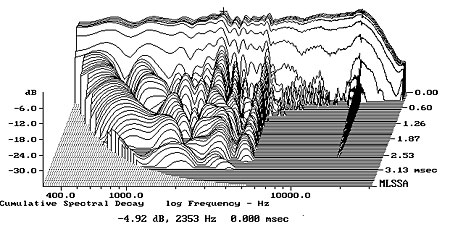
Fig.9 Harbeth LS5/12A, cumulative spectral-decay plot at 50" (0.15ms risetime).
Finally, I examine the vibrational behavior of a loudspeaker's cabinet by taping a simple PVDF-film accelerometer to the panels and driving the loudspeaker with the MLSSA signal at a high level (around 7.6V RMS). The computer can then calculate the impulse response of the panel from the output of the accelerometer, which is amplified/buffered by a small battery-powered preamplifier. Although the impedance traces were smooth, the Harbeth's cabinet does have one panel resonance detectable, just under 400Hz. This can be seen in fig.10.—John Atkinson

Fig.10 Harbeth LS5/12A, cumulative spectral-decay plot of accelerometer output fastened to center of enclosure side panel halfway up from the base. (MLS driving voltage to speaker, 7.55V; measurement bandwidth, 2kHz.)
Footnote 1: Trevor Butler, in Hi-Fi News & Record Review, December '93, Vol.38 No.12, p.39.
|
| ||||||||||
- Log in or register to post comments


| Loudspeakers Amplification Digital Sources | Analog Sources Accessories Featured | Music Columns Retired Columns | Show Reports | Features Latest News Community | Resources Subscriptions |
 © 2024 Stereophile
AVTech Media Americas Inc., USA
All rights reserved

