| Columns Retired Columns & Blogs |
Genesis II.5 loudspeaker system Measurements
Sidebar 3: Measurements
John Atkinson measured the II.5s in my new listening room—a much easier proposition, given the system's weight, than trucking it to the test lab in Santa Fe—and was therefore only able to perform a limited set of measurements. The II.5's impedance magnitude and phase angle are shown in fig.1. Note that this plot is of the midrange and tweeter section only—not the woofers. The minimum impedance is 3 ohms through the top octave, with a slightly higher 3.8 ohms or greater through the rest of the band. The combination of the phase-angle and the impedance magnitude in the crossover region to the woofer is fairly demanding but should not cause high-quality amplifiers any problems. Below 100Hz, we can see the impedance rise as a result of the high-pass crossover elements. Overall, the II.5 presents a moderately easy load for the amplifier because the power amplifier is relieved of the burden of driving the woofers.

Fig.1 Genesis II.5, mid/treble array electrical impedance (solid) and phase (dashed) (2 ohms/vertical div.).
Fig.2 shows the nearfield responses of the woofer and midrange. The effect of the woofer amplifier's low-pass adjustment can be seen as the two divergent traces in the woofer response. This is a fairly wide range of adjustment, changing the woofers' output by a full 6dB at 100Hz. This is exactly what I'd expect from the listening: increasing the woofers' high-pass frequency added midbass, but if set too high produced less good integration between the point-source woofer and hemispherical midrange. Measured in the nearfield, the ribbon midrange appears to peak at the lower end of its passband, exhibiting a 5dB rise just before it rolls off. This could well be a measurement artifact. Note, however, the woofer's astonishing bass extension, with sub–20Hz response.
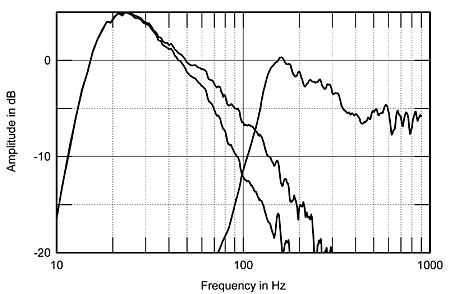
Fig.2 Genesis II.5, nearfield woofer and midrange ribbon responses showing effect of woofer crossover control set to its maximum and minimum positions (5dB/vertical div.).
The II.5's response measured at a distance of 45", a height of 46", and 10° off the ribbon axis on the tweeter side, is shown in fig.3. (The II.5's response on the central tweeter axis, not shown, features a null at the crossover between the midrange and tweeters. The outputs of the ribbon and tweeter array actually add-in phase to the side, the normal listening position with no toe-in, with a smooth transition between them.) The excess treble will be less evident at a normal listening axis of 42"–44"—the II.5 sounds as though it has too much treble if you sit too high (which is difficult to do).

Fig.3 Genesis II.5, anechoic response at 45" level with central tweeter, 46" from floor, on axis 10° to the tweeter side of the ribbon, corrected for microphone response, with complex sum of nearfield woofer and ribbon responses below 312Hz.
Moreover, the apparent depression through the entire midrange is a function of the necessarily close measurement distance. Although the woofer and tweeter obey the inverse square law (a reduction in sound-pressure level of 6dB for each doubling of distance away from the source), the line-source ribbon midrange's cylindrical radiation pattern causes an output drop of only 3dB with each doubling of distance. Consequently, the II.5's midrange balance will be distance-dependent. Note that this measurement was taken at a distance of only 45"—far closer than any practical listening distance—due to the need to suppress the contribution of the room as much as possible.
The II.5's significant variation in tonal balance with listening height is confirmed by fig.4, the II.5's response change up and down the vertical axis. The response on the 46"-high axis (the center tweeter) has been subtracted from all the curves, thus appearing to be a flat line; the other plots are therefore the deviation from the 46" response. The traces are, from top to bottom, measured at 54", 50", 46", 42", and 38". As you move below 44", the mid-treble drops, giving a dull balance. I sat on pillows to get the correct treble balance, which brought my ears up to about 44". Two inches here make a big difference. Interestingly, listening height affects the mid-treble, not the top octaves as you'd expect.
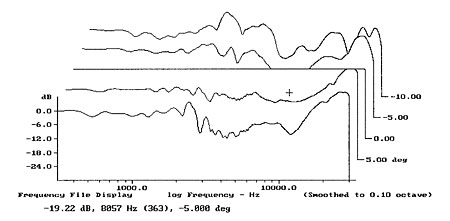
Fig.4 Genesis II.5, vertical response family, normalized to response on central tweeter axis (from top to bottom): difference in response 54" from floor; 50" from floor; reference response; difference 42" from floor; and 38" from floor.
What is most important is how the speaker measures at my listening seat. JA took the in-room response for each II.5 at my listening position with the speaker controls set at their normal listening positions. The average of the two curves is shown in fig.5. (The in-room balance of the pair was very closely matched throughout the midrange and treble.) The response is smooth and flat, but with an overall tendency toward an uptilted bass and a downtilted treble. Loudspeakers that measure flat tend to be too bright, in my experience. The curve could be summed up as "flat, with lots of bass," which corresponds to my overall impression of the II.5.

Fig.5 Genesis II.5, average of left and right in-room speaker responses at RH listening position.
Fig.6 is the II.5's impulse response measured on the center tweeter axis at a distance of 1m. The II.5's non–time-coherent nature is confirmed by fig.7, the step response. The tweeter's output (the first spike) leads that of the midrange (the second hump), which is also significantly ahead of the woofer.

Fig.6 Genesis II.5, impulse response on central HF axis at 1m (5ms time window, 30kHz bandwidth).

Fig.7 Genesis II.5, step response on central HF axis at 1m (5ms time window, 30kHz bandwidth).
The cumulative spectral-decay, or waterfall, plot (fig.8) is excellent. The loudspeaker decays very quickly and cleanly. A slight resonance can be seen at 1500Hz, but this is inconsequential. This is one of the better waterfall plots I've seen.

Fig.8 Genesis II.5, cumulative spectral-decay plot at 45" (0.15ms risetime).
Finally, I caution you about reading too much into the shapes of the curves presented here. The II.5 is very different from conventional loudspeakers, and its measured performance will change radically with the test setup. Of all the measurements presented, fig.5 comes the closest to representing the loudspeaker's perceived balance.—Robert Harley
- Log in or register to post comments
