| Columns Retired Columns & Blogs |
EAR V20 integrated amplifier Measurements
Sidebar 3: Measurements
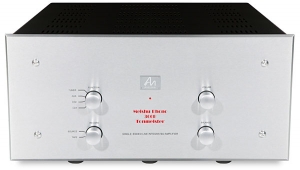
The EAR V20 left Chip Stern's New York apartment in pristine condition, but by the time it arrived at our Santa Fe offices there were visible signs of shipping damage, including dents in one of the protective tube cages. Nothing in the following measurements, however, suggests any operational damage or degradation.
In normal operation, the cages surrounding the EAR V20's tubes get quite warm, but never uncomfortably hot. It's likely that the lower-than-normal operating temperature is due to the choice of multiple small, low-power output tubes in place of a few large ones.
The V20's line input impedance measured 35.4k ohms at 1kHz. The output impedance from the 8 ohm speaker terminals measured a minimum of 0.77 ohms and a maximum of 1.14 ohms, the latter at 20kHz. The corresponding values from the 4 ohm taps were 0.47 ohms and 0.62 ohms—respectably low values for a tube amplifier. The output impedance at the V20's tape-monitor jacks was 1k ohm with a 25 ohm source impedance, and 1.56k ohms with a 600 ohm output impedance, indicating an unbuffered tape output. At the maximum setting of the level control the voltage in 8 ohms gain was 31.3dB at the 8 ohm taps, 28.1dB at the 4 ohm taps.
I took all measurements (except for gain) at a level setting that produced a gain of 29.2dB with an 8 ohm load driven from the 8 ohm taps. (100mV input produced a 1W output.) The physical setting of the control at this point was approximately 4:00—very close to maximum gain.
The DC offset measured 0.2mV in the left channel, 0.1mV in the right—essentially irrelevant. The signal/noise ratio (ref. 1W into 8 ohms) measured 76.5dB from 22Hz to 22kHz and 71.5dB from 10Hz to 500kHz, both unweighted, and 85.4dB A-weighted. The EAR is noninverting from its inputs to its loudspeaker terminals. Its volume-control tracking was good, within 0.13dB over the range from 9:00 to maximum. However, the right channel was approximately 0.5dB louder than the left at all tested positions. This might well vary from sample to sample and/or with different sets of tubes.
Fig.1 shows the V20's frequency response. The response into a simulated loudspeaker load does indicate the dips and peaks typical of an amplifier with a high output impedance, but in this case the output impedance is only moderately high, and the response alterations are much more benign than is often seen in tube amplifiers. Fig.2 shows the EAR's output waveform with a 10kHz squarewave. This is a fine result with a good risetime, no overshoot, and rounding of the leading edge of the waveform typical of most amplifiers, tube or solid-state. The EAR's 1kHz squarewave response, not shown, is excellent.

Fig.1 EAR V20, frequency response at (from top to bottom): 1W into 8 ohms, 8 ohm tap, 2W into 4 ohms, 4 ohm tap, and 2.828V into simulated loudspeaker load, 4 ohm tap (0.5dB/vertical div., right channel dashed).

Fig.2 EAR V20, small-signal 10kHz squarewave into 8 ohms.
The physical separation of the two channels' tubes suggests an above-average channel separation, and this is what I found. L-R separation was slightly better than in the other direction, but both were better than 95dB below 2kHz. Above that frequency, the crosstalk rose at the usual 6dB/octave, due to capacitive coupling between channels, to reach -70dB at 50kHz.
The THD+noise vs frequency results in fig.3 are very good for a tube amplifier. This is obviously a very linear circuit, particularly in the midband. Fig.4 shows the 1kHz THD+noise output waveform of the EAR at 4W into 2 ohms. While there is an obvious second-harmonic dominance, there are also clear indications of higher-order components. These are more pronounced with a 2 ohm load (not shown).

Fig.3 EAR V20, THD+noise (%) vs frequency at (from top to bottom at 2kHz): 4W into 2 ohms, 2W into 4 ohms (both 4 ohm tap), 1W into 8 ohms (8 ohm tap), and 2.83V into simulated loudspeaker load (right channel dashed).

Fig.4 EAR V20, 1kHz waveform at 2W into 4 ohms (top), distortion and noise waveform with fundamental notched out (bottom, not to scale).
Fig.5 shows the EAR's output spectrum driving 50Hz at 18W into a 4 ohm load. The most significant artifact is the third harmonic at 150Hz (-43dB, or 0.7%). The intermodulation in the output caused by a combined 19+20kHz source at 13.5W into 4 ohms is shown in fig.6. The highest IM here is at 18kHz (-51.6dB, or just under 0.3%). At 14.7W into 8 ohms (not shown) the IM at 18kHz dropped to -53.8dB (about 0.15%), but increases to -83dB (just under 0.01%) at 1kHz.

Fig.5 EAR V20, spectrum of 50Hz sinewave, DC-1kHz, at 18W into 4 ohms, 4 ohm tap (linear frequency scale).

Fig.6 EAR V20, HF intermodulation spectrum, DC-22kHz, 19+20kHz at 13.5W into 4 ohms, 4 ohm tap (linear frequency scale).
Fig.7 shows the THD+noise percentage vs output power curves for the V20, one channel driven, at 1kHz. The discrete clipping measurements (1% THD+noise at 1kHz) are shown in Table 1. The V20 easily exceeds its specified output power.

Fig.7 EAR V20, distortion (%) vs continuous output power into (from bottom to top at 1W): 8 ohms (8 ohm tap), 4 ohms, 2 ohms (both 4 ohm tap).
Table 1 EAR V20
| Output power at 1kHz, 1% THD+noise | |||
| Both Channels Driven | One Channel Driven | ||
| W (dBW) | W (dBW) | ||
| Load | (L) | (R) | (L) |
| 8 ohms | 28.5 (14.6) | 29.3 (14.7) | 29.4 (14.7) |
| (line V) | 116V | 116V | 113V |
| 4 ohms | 26.5 (11.2) | 26.7 (11.3) | 26.8 (11.4) |
| (line V) | 116V | 115V | 115V |
| 2 ohms | 28.4 (8.5) | ||
| (line V) | 115V | ||
Using the Miller Audio Research Amplifier Profiler, John Atkinson tested the V20's output power under toneburst conditions, which more closely approximates how the amplifier will behave with a music signal. The result for the 4 ohm tap is shown in fig.8. The maximum output power from this tap is actually given into 2 ohms—red trace, 32.15W for 1% THD, 35.4W for 3% THD—suggesting that the V20's output transformer is optimized for loads slightly lower than the nominal rating. This is sensible, given that 4 ohm loudspeakers generally drop lower than 4 ohms for some of the time. The low loop negative feedback means that the distortion rises with increasing power levels, the amplifier clipping very gently.

Fig.8 EAR V20, 4 ohm tap, distortion (%) vs 1kHz burst output power into 8 ohms (green trace), 4 ohms (blue), 2 ohms (red), and 1 ohm (black).
CS was somewhat bothered by the V20's bass character, so JA repeated the fig.8 tests at 20Hz, as well as 5kHz. The results are shown in fig.9. While the amplifier's 5kHz behavior (red trace) was basically identical to that at 1kHz (black), at 20Hz (blue trace), the rise in distortion with output power was complex, with a sudden rise above 5W, but local minima at 12W and 20W. It is possible that this behavior does correlate with the bass region's lack of viscerality.
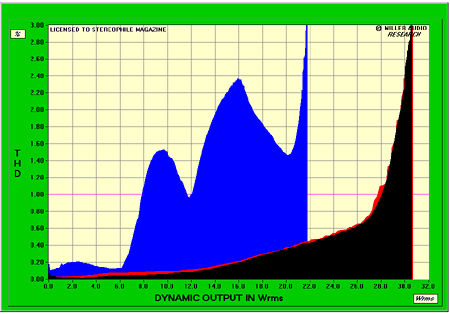
Fig.9 EAR V20, 4 ohm tap, distortion (%) vs burst output power into 4 ohms at 1kHz (black trace), 5kHz (red), and 20Hz (blue).
This is a very solid set of measurements for an integrated tube amplifier. The EAR is low-powered, but within its limitations it performs very well on the test bench.—Thomas J. Norton
|
|
| ||||||||||
- Log in or register to post comments


| Loudspeakers Amplification Digital Sources | Analog Sources Accessories Featured | Music Columns Retired Columns | Show Reports | Features Latest News Community | Resources Subscriptions |
 © 2024 Stereophile
AVTech Media Americas Inc., USA
All rights reserved

