| Columns Retired Columns & Blogs |
Dynaudio Contour 3.3 loudspeaker Measurements part 3
In the time domain, the Dynaudio's step response (fig.8) reveals that the speaker is not time-coherent, despite its use of first-order crossover filters. The tweeter is the sharp, positive-polarity up/down pulse just before the 4ms mark, followed by the negative-polarity, slower midrange unit (not quite properly aligned on this high tweeter axis), then by the positive polarity woofer steps. The associated cumulative spectral-decay or waterfall plot (fig.9) is superbly clean, other than a slight bit of hash in the presence region. I couldn't hear any subjective consequences of this behavior, the Contour 3.3 sounding superbly free from high-frequency grain.
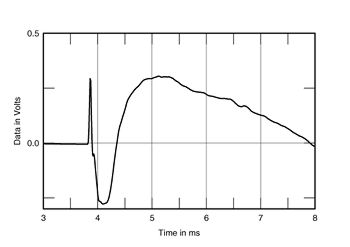
Fig.8 Dynaudio Contour 3.3, step response on tweeter axis at 50" (5ms time window, 30kHz bandwidth).

Fig.9 Dynaudio Contour 3.3, cumulative spectral-decay plot at 50" (0.15ms risetime).
Finally, despite its size, the Dynaudio's enclosure is free from resonant problems, implying an optimally braced, well-damped construction. What modes were present were both high in frequency and low in level, the ideal condition. Fig.10, for example, shows a waterfall plot calculated from the output of a simple PVDF-tape accelerometer fastened to the front baffle below the woofers. The only significant mode present is at 648Hz, well above the region where it could lead to coloration. And even the big side panels had just one more mode present, at 300Hz, though this was equally low in level.—John Atkinson

Fig.10 Dynaudio Contour 3.3, cumulative spectral-decay plot of accelerometer output fastened to cabinet baffle below woofers. (MLS driving voltage to speaker, 7.55V; measurement bandwidth, 2kHz.)
|
|
| ||||||||||
- Log in or register to post comments


| Loudspeakers Amplification Digital Sources | Analog Sources Accessories Featured | Music Columns Retired Columns | Show Reports | Features Latest News Community | Resources Subscriptions |
 © 2024 Stereophile
AVTech Media Americas Inc., USA
All rights reserved

