| Columns Retired Columns & Blogs |
Cyrus CD 8x CD player Measurements
Sidebar 3: Measurements
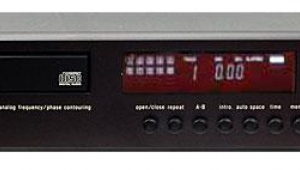
The Cyrus CD 8x player had a maximum output level of 2.23V at 1kHz, almost 1dB above the CD standard of 2V RMS. Its absolute polarity was noninverting when the front-panel display read "PHASE NORMAL," inverting when it said "PHASE INVERTED." The output impedance was a usefully low 52 ohms across the audioband. Error correction was superb, the player coping with gaps in the Pierre Verany Test CD's data spiral up to 1.5mm in length without audible glitches. I perform this test both listening to the 500Hz tone on headphones and when a player has a digital output, monitoring the status of the bits in that output using RME's Digicheck software. Peculiarly, Digicheck indicated that bit 18 in the Cyrus' output datastream was continually set high, except when there was an interruption in the data from a disc error. This should not have audible consequences if the CD 8x is used as a transport with an outboard DAC, but it's a bit odd, nonetheless.
Other than a very slight rise in the top octave, the Cyrus' frequency response was flat (fig.1, top pair of traces), though a slight (0.1dB) channel imbalance was evident. Repeating the response measurement with pre-emphasized data gave the lower pair of traces in fig.1: there is a significant lack of energy that will make the few discs that require de-emphasis sound a little distant and uninvolving. Channel separation (fig.2) was superb at better than 120dB in both directions below 2kHz, and still better than 105dB at 20kHz.
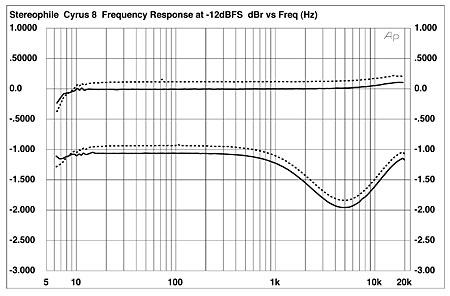
Fig.1 Cyrus CD 8x, frequency response at –12dBFS into 100k ohms, with de-emphasis (bottom below 1kHz) and without (Right channel dashed, 1dB/vertical div.).
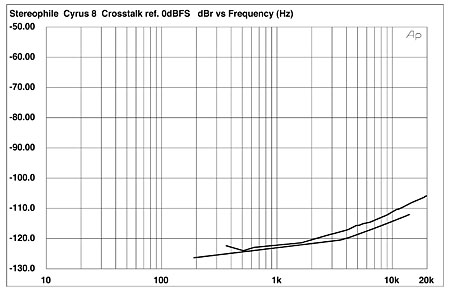
Fig.2 Cyrus CD 8x, channel separation (10dB/vertical div.)
A spectral analysis of the player's output while it decoded data representing a dithered 1kHz sinewave at –90dBFS, using a swept 1/3-octave bandpass filter, gave the traces shown in fig.3. These peak at almost exactly –90dBFS, and no supply-related or harmonic spuriae can be seen above the 16-bit noise floor. Repeating the spectral analysis, this time over a wider, 200kHz bandwidth and playing data representing a 1LSB DC offset, gave fig.4. The audioband noise is very low, but the noise floor rises steeply above 30kHz, presumably due to the noiseshaping used by the DAC chips. Unusually, it peaks at 66kHz before continuing its rise above 100kHz.
Fig.3 Cyrus CD 8x, 1/3-octave spectrum of dithered 1kHz tone at –90dBFS, with noise and spuriae (16-bit CD data, right channel dashed).
Fig.4 Cyrus CD 8x, 1/3-octave spectrum of –1LSB, with noise and spuriae (16-bit CD data, right channel dashed).
Correlating with the good linearity and low noise implied by figs.3 and 4, the plot of the Cyrus 8x's DAC's linearity error is excellent (fig.5), the only linearity error evident actually being due to the dither noise encoded on the test CD. Accordingly, the Cyrus player's reproduction of an undithered sinewave at exactly –90.31dBFS was essentially perfect (fig.6), with very good waveform symmetry, and the three DC voltage levels described by these data clearly apparent.
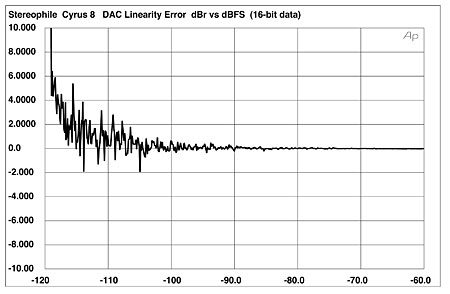
Fig.5 Cyrus CD 8x, left-channel departure from linearity, 16-bit CD data (2dB/vertical div.).
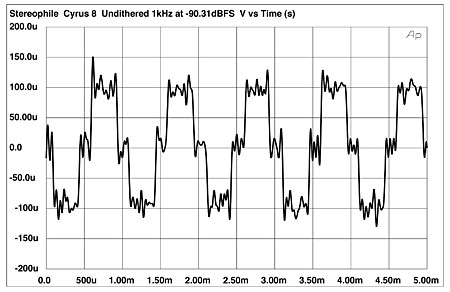
Fig.6 Cyrus CD 8x, waveform of undithered 1kHz sinewave at –90.31dBFS, 16-bit CD data.
Nonlinear distortion levels for high-level signals were very low (fig.7). The left channel was slightly worse than the right, the second and third harmonics lying at –103.3dB and –101.7dB compared with –110dB and –111dB, respectively, though the difference is of only academic interest, given these very low levels. The noise floor in this graph is actually that of the FFT analyzer; dropping the signal level to the same –90dBFS used to generate fig.2 gave the spectrum shown in fig.8. Other than some AC-supply harmonics close to the –120dB line (!), all the noise and harmonic-distortion components are close to 35dB below the signal level, which is as good as it gets with 16-bit digital data. (If you're puzzled why the noise floor is flat with frequency in this graph but slopes up in fig.3, this is due to the difference in the measurement and plotting techniques. Each band in the swept 1/3-octave bandpass filter used to generate fig.3 includes the contribution of more frequencies as the frequency increases, hence what would be a flat floor with a linear frequency scale appears to slope up with a logarithmic frequency scale.)
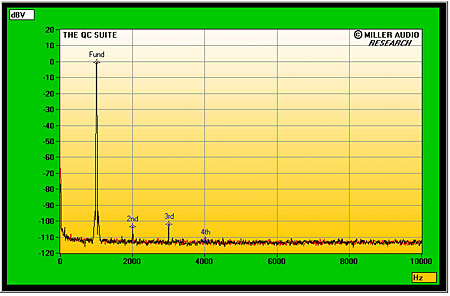
Fig.7 Cyrus CD 8x, spectrum of 1kHz sinewave at 0dBFS into 4k ohms, DC–10kHz (linear frequency scale).
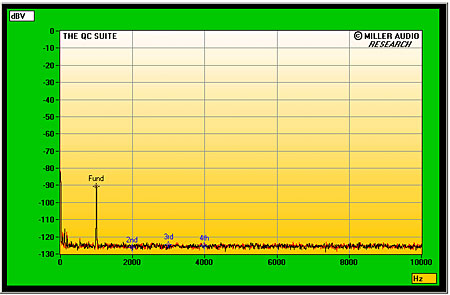
Fig.8 Cyrus CD 8x, spectrum of 1kHz sinewave at –90dBFS into 4k ohms, DC–10kHz (linear frequency scale).
High-frequency intermodulation distortion was also very low (fig.9).
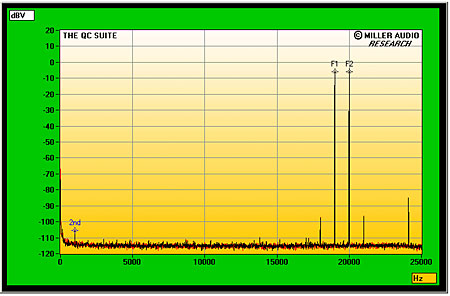
Fig.9 Cyrus CD 8x, HF intermodulation spectrum, 19+20kHz at 0dBFS peak into 4k ohms, DC–24kHz (linear frequency scale).
I found no differences in the analog output signal in the preceding tests when I used the external PSX-R power supply. However, there was a small difference evident when I examined the CD 8x's rejection of word-clock jitter. Fig.10 shows a narrowband spectral analysis of the Cyrus player's output without the power supply, while it decoded data representing a high-level tone at exactly one quarter the sampling frequency with the LSB toggling on and off at 229.6Hz, this also an exact integer fraction of the sample rate. This signal is very much a worst case for exciting jitter; even so, the level of jitter-related sideband energy present in the analog signal was a low 252 picoseconds peak–peak.
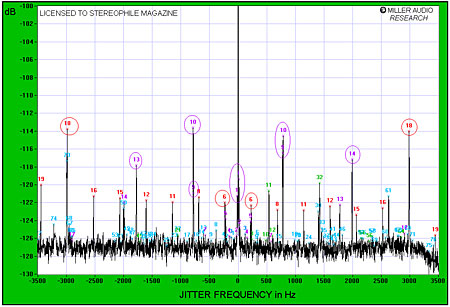
Fig.10 Cyrus CD 8x, high-resolution jitter spectrum of analog output signal (11.025kHz at –6dBFS sampled at 44.1kHz with LSB toggled at 229Hz, 16-bit CD data). Center frequency of trace, 11.025kHz; frequency range, ±3.5kHz.
With the exception of the 13th harmonic of the 229.6Hz stimulus at 2985Hz (red "18" markers), the data-related jitter (red numeric markers) lies at the residual level in the test signal. High-level sidebands can be seen at ±786Hz (purple "10" markers). Adding the power supply eliminated the high-frequency data-related sidebands (not shown) but added some other sidebands around 3kHz, increasing the measured jitter to a still low 279ps.
Overall, the Cyrus CD 8x offers superb measured performance—about as good as you can get from 16-bit digital audio.—John Atkinson/
|
| ||||||||||
- Log in or register to post comments


| Loudspeakers Amplification Digital Sources | Analog Sources Accessories Featured | Music Columns Retired Columns | Show Reports | Features Latest News Community | Resources Subscriptions |
 © 2024 Stereophile
AVTech Media Americas Inc., USA
All rights reserved

