| Columns Retired Columns & Blogs |
Cutting Corners Page 2
According to the simplified view of fig.1, we should expect to see edge reflections occurring between about 200 and 700 microseconds (µs) after the direct sound, with peaks in the reflected energy at 300µs and 650µs. An important point to note about this time scale is that these delays are all less than 1 millisecond (1ms), although they would obviously increase with larger baffle dimensions. (When path-length differences between the baffle edges and listening position are added in, the time delays increase slightly, but not by much. For instance, at a listening distance of 3m or 10', edge reflections from the sides of the baffle will be delayed by only a further 4µs.)
Footnote 2: T. Lokki et al, "An Efficient Auralization of Edge Diffraction," AES 21st International Conference, June 2002.
Sub-1ms delay is significant because it is at about 1ms that the precedence (Haas) effect comes into play, whereby first-arrival and delayed sounds are fused—ie, perceived as a single event—and the localization of the sound source is determined primarily by the former. For shorter delays, as here, the sound source appears to be localized somewhere between the origins of the first-arrival and delayed sound, an effect known to psychoacousticians as "summing localization." We can conclude from this that time-smearing due to edge reflections is likely to give rise to a spatial smearing of apparent sound-source location—a subjective outcome that is known to be associated with loudspeaker diffraction effects, as I'll describe in due course.
We can also use the time delays associated with the two peaks of fig.1 to estimate where we might expect to see related perturbations in the frequency response. A delay of 300µs corresponds to a distance of about 103mm, and 650µs to about 224mm. For a measuring distance of 1m, the overall path-length differences between the direct and edge-reflected sound will therefore be about 108 and 249mm, respectively. The first interference peaks in the frequency response should occur where these distances are each equivalent to half a wavelength—ie, at 1.6kHz and 690Hz—and the first interference dips at double these frequencies; ie, 3.2kHz and 1.4kHz.
Of course, the real edge-reflection behavior will be much less clear-cut than fig.1 suggests, because neither driver in fact acts as a point source. The bass-mid unit's diaphragm in particular occupies a substantial fraction of the baffle width, so some parts of it are much closer to a given baffle edge than assumed above, and others are much farther away. As a result, we can expect the edge-reflection behavior to be even more smeared in time than fig.1 suggests. Also, we have to bear in mind that the bass-mid unit's output will become significantly directional at higher frequencies, so the energy reaching the baffle edges will be attenuated. Because of its smaller diaphragm the tweeter is much less directional, but at the lower frequencies identified above its contribution will also be attenuated, this time by the crossover filtering. All this makes for a more complex outcome.
Algorithms exist (footnote 2) to make quite precise simulations of diffraction behavior at baffle edges, and many loudspeaker CAD packages now include diffraction as part of the modeling process. But our willfully simplified prediction of the AE100's behavior turns out to be not too wide of the mark, as fig.2 reveals. Here are overlaid the two frequency responses measured using MLSSA, one with the AE100 in free air (red trace), the second with its front poking through and flush with the surface of the large chipboard baffle (blue trace).
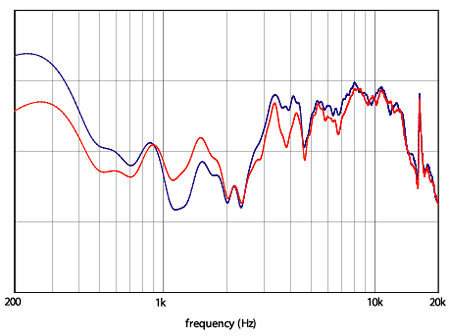
When comparing these traces, disregard the increasing disparity between the plots below 900Hz. This results from the so-called diffraction step—the frequency range over which the radiation space "seen" by the drive-units changes from 4pi steradians (full space) to 2pi steradians (half space)—moving as a result of the change in effective baffle size. Elsewhere, the major departures (shown more clearly in fig.3, which plots the difference between the blue and red traces) are found between 1 and 4kHz—about where we predicted on the basis of fig.1, although the details don't bear too close an examination. The largest departures amount to almost 3dB, and fall within a frequency range where the ear is acknowledged to be at its most sensitive.

It is hard to believe, even on this frequency-domain evidence alone, that the effects of baffle-edge radiation are innocuous in this case, or probably in the case of any speaker that has sharp baffle edges. That said, the subjective impact of edge reflections is not something that can be gleaned from this experiment, and it is not a topic on which Olson expounded. Indeed, very little has been published on the subject, other than an important study carried out at Acoustic Research in the late 1970s by James Kates (footnote 3). As a result of Kates' work, AR was so convinced of the importance of edge reflections (and supplementary reflections from baffle protuberances and the hollow of the bass-mid cone) that for some years thereafter it sold speakers fitted with its patented Acoustic Blanket—a layer of sound-absorbent material bonded to the front baffle to attenuate grazing incidence radiation from the drive-units. In AR's listening tests, fitting this blanket resulted in three distinct areas of subjective improvement: better tonal accuracy, more stable stereo imaging, and a narrowing of the width of virtual sound sources—all much as you might anticipate from removing the frequency-domain ripples and time-domain smearing that short-period reflections introduce.
Inaction
So why should it be—despite Olson's pioneering work of more than 50 years ago and AR's seminal study of 25 years back—that loudspeaker cabinets evince a continuing lack of concern about edge reflections among many speaker designers? That's a question the designers should answer themselves, not least because there may be more than one explanation. In fact, they should be pressed to answer it, because we now find ourselves in a curious situation: In one part of the audio industry there is a lot of hand-wringing on the subject of energy smear effects in digital filters while, a little downstream, a major cause of energy smear in loudspeakers goes comparatively unremarked.
One possible explanation for this apparent disregard of diffraction effects may simply be that measurement tools for identifying short-period reflection effects in loudspeakers are not widely available. Although there is little to stop loudspeaker manufacturers from conducting tests along the lines I have with the AE100, clearly, those of us who measure loudspeakers as part of the review process are not going to start messing around with room-filling baffles that must be customized to suit each and every test speaker. What's needed is a measurement method that can identify edge reflections without much additional time and effort; the whole issue might then inspire more attention.
In the case of MLSAA, the most obvious analysis tool with which to go seeking reflection effects is the energy-time curve (ETC). Fig.4 shows superimposed MLSSA-generated ETCs for the AE100, as before, in free space (red trace) and flush with the large baffle (blue trace). There are obvious divergences between the two plots at around 400µs and 700µs—times that accord reasonably well with the predictions of fig.1 and probably do represent energy associated with baffle-edge re-radiation. But the ETC is sensitive to a lot more besides, and because of this is not best suited to the identification of diffraction effects in particular. Presented with the red trace alone of fig.4, as you would be in a normal reviewing circumstance, no reviewer could reliably point to any feature of it and declare it due to edge diffraction. The ETC just isn't diagnostic enough.

So what is? Well, you may be surprised to learn that a method well suited to precisely this type of analysis was first proposed the better part of 40 years ago, that it has been tried and found to be effective in loudspeaker measurement (AR applied it in the study I've already mentioned), that one loudspeaker reviewer has already used it, and that it has even been offered as a component of one speaker-measurement package (Liberty Audiosuite). Yet I'll wager that the vast majority of Stereophile readers have never heard of it. It's called cepstral analysis.
Cepstral analysis—a world of terminological re-ordering where spectral becomes "cepstral," frequency becomes "quefrency," and filtering becomes "liftering"—deserves a lot more space being devoted to it than remains here, so it will have to be a topic I revisit. For now, I'll be content if you henceforth regard 90 degree baffle edges with suspicion and study the loudspeakers pictured in reviews and advertisements with a more critical, diffraction-attuned eye. You may even come to wonder, as I often do, how much better a particular design might sound with a simple dulling of its sharp edges.
Footnote 2: T. Lokki et al, "An Efficient Auralization of Edge Diffraction," AES 21st International Conference, June 2002.
Footnote 3: J.M. Kates, "Loudspeaker Cabinet Reflection Effects," JAES, Vol.27 No.5 (May 1979), pp.338-350.
|
| |||||||||
- Log in or register to post comments


| Loudspeakers Amplification Digital Sources | Analog Sources Accessories Featured | Music Columns Retired Columns | Show Reports | Features Latest News Community | Resources Subscriptions |
 © 2024 Stereophile
AVTech Media Americas Inc., USA
All rights reserved

