| Columns Retired Columns & Blogs |
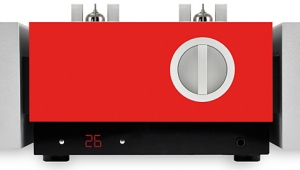
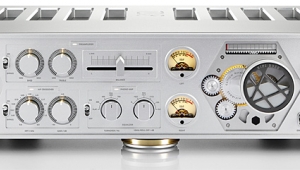
Chord CPM 3300 integrated amplifier Measurements
Sidebar 3: Measurements
Footnote 1: As a rule of thumb, the temperature at which something becomes too hot to keep your hand on it is 60 degrees C (140 degrees F).—John Atkinson
My usual practice before measuring an amplifier is to run it at one-third power into 8 ohms for one hour. This severely stresses a design with a class-B output stage, as it results in the maximum heat being dissipated in the output transistors. However, I cut short the preconditioning with the Chord CPM 3300 after 30 minutes. This was partly because the rear heatsinks were far too hot to touch (footnote 1), as was the black mesh grille on the top, but also because the measured distortion had risen slowly and steadily throughout that time, reaching 0.53% from a cold start of 0.3%. (I made sure the bottom vents weren't blocked during the testing.) This preconditioning is admittedly a very severe test for an amplifier, but the Chord's behavior suggests that it has inadequate heatsinking for sustained high-power use, such as at a party, particularly with low-impedance speakers. (This also implies that the Integra legs are hardly an option, if the amplifier is to be kept off the floor.)
The balance knob was loose on the shaft when I received the review sample for measurement. I equalized the channel outputs with the remote before performing any measurements. The Chord's architecture allows for four different gain settings to be applied universally across the inputs, or individually to allow for sources with different output levels. Set to "x1," the maximum level from the preamp output was 0.6dB higher than the input, with a corresponding voltage gain from the power-amplifier section of 30.6dB. Set to "x2," the levels increased slightly more than the expected 6dB, at 7.9dB and 37.9dB, respectively. The "x5" and "x7" settings resulted in gains from the preamp outputs of 11.9dB and 14.6dB, respectively, and 41.9dB and 44.6dB from the power-amp outputs. I performed all subsequent testing with the gain set to "1."
The XLRs are connected with pin 2 hot. With the positive speaker lead connected to the red WBT terminal, the amplifier inverted polarity via the unbalanced input jacks. The input impedance at 1kHz was a usefully high 55.9k ohms unbalanced and 86k ohms balanced. The output impedance from the preamp jacks was a low 100 ohms over most of the band, rising trivially to 115 ohms at 20Hz. From the Chord's speaker terminal, the source impedance was a very low 0.06 ohm, rising slightly to 0.08 ohm at 20kHz. As a result, any interaction between the amplifier's source impedance and the impedance of our simulated loudspeaker was below ±0.1dB.
The overall frequency response (fig.1) sensibly rolled off above the audioband, but some slight wrinkles can be seen disturbing the otherwise smooth rolloff. These wrinkles might be associated with the very slight amount of overshoot on the otherwise excellent shape of the 1kHz (fig.2) and 10kHz (fig.3) squarewaves. (I had to average 64 individual readings for these waveforms due to the presence of very-high-frequency noise. This noise could be reduced in level by grounding the negative speaker lead at the Audio Precision test set, but this increased the level of a 120Hz hum component; I thought this strange, given the Chord's use of a switching power supply. Unfortunately, a computer failure meant I couldn't investigate the Chord's noise behavior any further.)
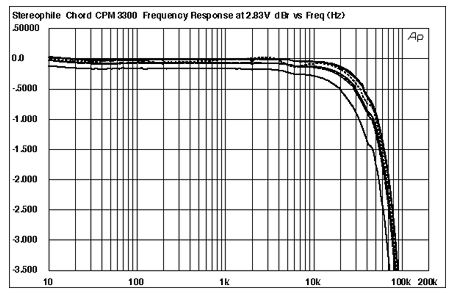
Fig.1 Chord CPM 3300, frequency response at (from top to bottom at 2kHz): 2.83V into dummy loudspeaker load, 1W into 8 ohms, 2W into 4 ohms, 4W into 2 ohms (0.5dB/vertical div.).
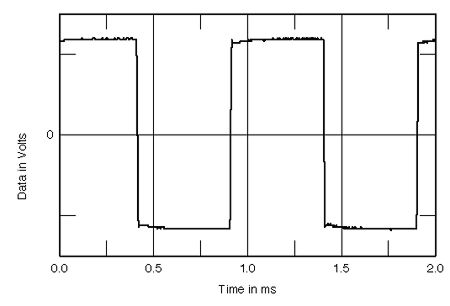
Fig.2 Chord CPM 3300, small-signal 1kHz squarewave into 8 ohms.
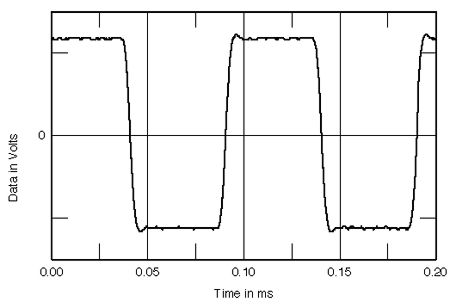
Fig.3 Chord CPM 3300, small-signal 10kHz squarewave into 8 ohms.
Channel separation via the balanced inputs is shown in fig.4. Below 1kHz, the crosstalk reading is dominated by the ultrasonic noise mentioned above. Above that frequency the crosstalk starts to rise due to capacitive coupling between the channels, but there is a strange minimum between 9 and 10kHz in both directions before the crosstalk resumes rising at the top of the audioband.
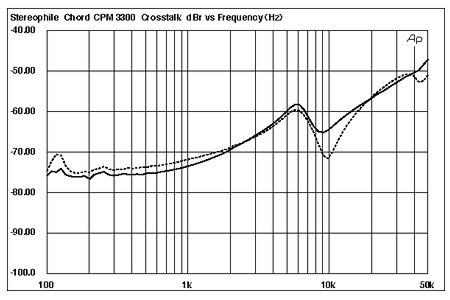
Fig.4 Chord CPM 3300, channel separation (10dB/vertical div., R-L dashed).
Plotting the THD+noise percentage against frequency for various loads at 9V gave the traces shown in fig.5. The measured distortion level doesn't change with frequency but does almost double each time the load impedance halves. The THD appears high, but this is due to the rather peculiar way the Chord's distortion changes with frequency (see below). Looking at the distortion waveform on the oscilloscope at this level (9V) was fruitless, as all that could be seen was noise. I had to increase the output level to an enormous 282W into 4 ohms to raise the distortion components out of the noise (fig.6); the distortion is strongly second-harmonic in nature, which will be subjectively benign at much higher levels than it appears in the CPM 3300.
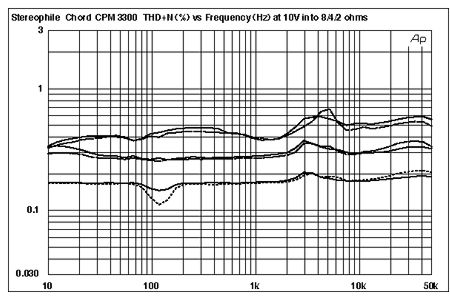
Fig.5 Chord CPM 3300, THD+noise (%) vs frequency at (from top to bottom at 5kHz): 9V into simulated loudspeaker load, 40W into 2 ohms, 20W into 4 ohms, 10W into 8 ohms.
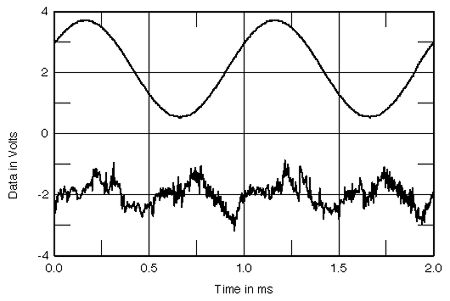
Fig.6 Chord CPM 3300, 1kHz waveform at 282W into 4 ohms (top), distortion and noise waveform with fundamental notched out (bottom, not to scale).
Fig.7 looks at the harmonic distortion in a different way, by calculating the spectrum of the CPM 3300's output spectrum while it drove a pure 50Hz tone into 8 ohms at two-thirds power. The only harmonic component that can be seen is, again, the second (100Hz), at a low -80dB (0.01%). A spectral line can be seen at 120Hz, but this is below the -90dB mark. The generally hashy-looking nature of the noise floor is due to the noise mentioned earlier.
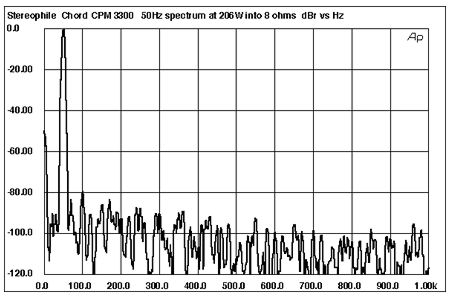
Fig.7 Chord CPM 3300, spectrum of 50Hz sinewave, DC-1kHz, at 206W into 8 ohms (linear frequency scale).
Though a number of 1kHz-spaced intermodulation components can be seen in a similar but wider-bandwidth spectrum taken while the Chord drove a punishing 1:1 mix of 19kHz and 20kHz just below visible clipping into 4 ohms (fig.8), these are all well below -80dB (other than the 1kHz difference component, which hovers at around -83dB, or 0.007%). But again, note the rather hashy-looking noise floor in this graph, particularly at lower frequencies.
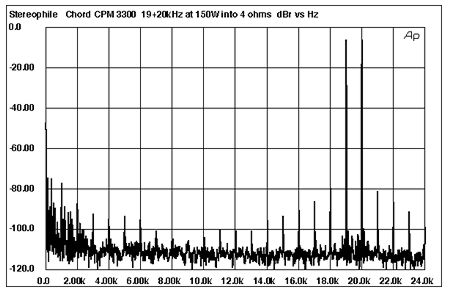
Fig.8 Chord CPM 3300, HF intermodulation spectrum, DC-24kHz, 19+20kHz at 150W into 4 ohms (linear frequency scale).
I mentioned earlier the rather unusual manner in which the Chord's distortion+noise percentage changed with output power. This can be seen in fig.9, with the amplifier driving 8 and 4 ohm loads with both channels driven and 2 ohms with just one channel driven. Below 2-3W, the percentage is dominated by noise, hence the linear decrease in the THD percentage with increasing power. There is a fairly abrupt rise in the percentage between 3 and 30W, which, as I mentioned above, seems to be due to increased noise rather than to actual distortion. This, again, decreases linearly with increasing power output until the clipping point is reached, indicated by the sharp knee in these traces.
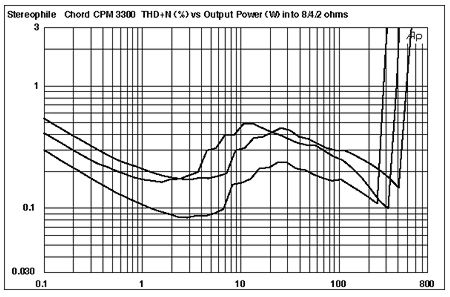
Fig.9 Chord CPM 3300, distortion (%) vs continuous output power into (from bottom to top at 10W): 8 ohms, 4 ohms, 2 ohms.
For consistency, we define clipping power as the level at which the measured THD+noise reaches 1%. Into 8 ohms, this was well above the Chord's specification, at 290W (24.6dBW). Despite the amplifier's very low output impedance, the current didn't double when the load impedance halved, resulting in outputs of 395W into 4 ohms (23.0dBW) and 500W into 2 ohms (21.0dBW) (footnote 2).
The Chord is indeed a powerhouse, and, with its blue- and red-LED-illuminated innards visible through its perforated top cover, easily the most eye-catching amplifier I have had in my lab. However, I didn't like how hot it got during the testing and I am bothered by the way its THD+noise changed with output level and load impedance. It should also be noted that the control circuitry locked up a number of times during the testing, necessitating powering the amplifier off and on and again to reboot the software.—John Atkinson
Footnote 1: As a rule of thumb, the temperature at which something becomes too hot to keep your hand on it is 60 degrees C (140 degrees F).—John Atkinson
Footnote 2: Our usage of "dBW" follows that established by UK reviewer Martin Colloms in the early 1980s, whereby an amplifier that acted as a perfect voltage source would give the same dBW figure into any load. Shortfalls from voltage-source behavior are thus easily seen as a reduced figure compared with the reference 8 ohm figure.—John Atkinson
|
|
| ||||||||||
- Log in or register to post comments


| Loudspeakers Amplification Digital Sources | Analog Sources Accessories Featured | Music Columns Retired Columns | Show Reports | Features Latest News Community | Resources Subscriptions |
 © 2024 Stereophile
AVTech Media Americas Inc., USA
All rights reserved

