| Columns Retired Columns & Blogs |
Cayin A-300B integrated amplifier Measurements
Sidebar 3: Measurements
Measuring the Cayin A-300B was a more complex task than usual: The amplifier offers three different output-transformer taps and two different degrees of loop negative feedback, which effectively makes it equivalent to six different amplifiers! I took a full set of measurements for each condition, but for reasons of space have reproduced here only the most significant graphs. I set the bias for each channel to the recommended 70mA and minimized the output-stage hum before performing the measurements. Halfway through the measurements the right channel failed, apparently due to a bad 300B output tube. The frequency response and THD measurements were therefore taken with the left channel only, and it wasn't possible to measure channel separation.
The Cayin offered a relatively modest amount of maximum voltage gain into 8 ohms. With zero negative feedback (LED illuminated orange), it offered 31.6dB from the 16 ohm tap, 29.9dB from the 8 ohm tap, and 27.85dB from the 4 ohm tap. Increasing the level of negative feedback (LED illuminated red) reduced these figures to 29.8dB, 27.6dB, and 25.4dB, respectively. Driving the amplifier from its Preamp In jacks gave 21.7dB (LED orange) and 19.5dB (LED red) from the 8 ohm tap, which suggest that the preamp section offers around 8dB of gain—a sensible choice.
When used via a high-level input, the A-300B was non-inverting from all of its output-transformer taps. Via the Preamp Input, it also preserved absolute polarity. The A-300B's input impedance was a usefully high 89k ohms at low and midrange frequencies with the volume control set to its maximum, this decreasing to a still high 60k ohms at 20kHz. Turning the volume control down to the 12:00 position reduced the input impedance to 59k ohms, while the Preamp Input input impedance ranged from 55k ohms at 20Hz to 50k ohms at 20kHz. The unweighted signal/noise ratios were dominated by the residual 60Hz hum, with the right channel quieter than the left, at 73.1dB vs 65.1dB (wideband ref. 2.83V into 8 ohms, 8 ohm output tap, LED illuminated orange, with the input shorted but the volume control set to its maximum). A-weighting improved these figures to a respectable 89dB and 87.2dB, respectively.
While the Cayin's output impedance was significantly higher than that of a typical solid-state design, and of course (see later) varied with both transformer tap and negative feedback level, it was not as high as I have encountered with some more conventional tubed designs. In the worst case—16 ohm tap, zero feedback—it measured 3.75 ohms at 20Hz and 1kHz, this rising to 5.75 ohms at 20kHz. Switching to the higher amount of feedback reduced these figures by 1 ohm. From the 8 ohm tap, the output impedance measured 2 ohms with zero feedback, and 1.5 ohms at low and midrange frequencies with higher feedback; at 20kHz, these rose to 2.7 and 1.8 ohms, respectively. From the 4 ohm tap at lower frequencies, the impedance was 1.2 ohms with zero feedback and 0.95 ohm with feedback; at 20kHz, these values rose to 1.5 and 1.1 ohms, respectively.
The A-300B's frequency response also varies with the transformer tap and the degree of negative feedback, as well as with load impedance. Fig.1 shows its behavior from its 8 ohm tap, with zero negative feedback. The response into higher impedances is basically flat up to 15kHz, with then a –3dB point into 8 ohms of 38kHz. The HF rolloff begins progressively earlier into lower impedances, the worst case being –2.2dB at 20kHz into 2 ohms. The modification of the response due to the Ohm's Law interaction between the amplifier's source impedance and the way in which the impedance of our standard simulated loudspeaker varies with frequency reaches ±1.3dB, which will be audible. Increasing the amount of negative feedback but keeping everything else the same (fig.2) extends the 8 ohm bandwidth to –3dB at 46kHz but sharpens the rolloff "corner." The increased feedback also reduces the output impedance, which in turn reduces the response variation with the standard load to ±1dB.

Fig.1 Cayin A-300B, volume control at maximum, 8 ohm tap, zero negative feedback, frequency response at 2.83V into (from top to bottom at 2kHz): simulated loudspeaker load, 16, 8, 4, 2 ohms (1dB/vertical div.).

Fig.2 Cayin A-300B, volume control at maximum, 8 ohm tap, high negative feedback, frequency response at 2.83V into (from top to bottom at 2kHz): 16 ohms, simulated loudspeaker load, 8, 4, 2 ohms (1dB/vertical div.).
The behavior was similar from the other two output taps (not shown), with the lowest bandwidth and greatest response variations evident from the 16 ohm tap with zero feedback—a –3dB point of 31kHz into 8 ohms, a response of –3dB at 20kHz into 2 ohms, and ±3dB variation—and the greatest bandwidth and smallest response variations evident from the 4 ohm tap with negative feedback: a –3dB point of 51kHz into 8 ohms, –2dB at 20kHz into 2 ohms, and ±0.7dB of response variation. The Cayin's handling of squarewaves was excellent, with no ringing apparent with any combination of output tap and load impedance. Fig.3, for example, shows a 10kHz squarewave captured from the 4 ohm tap driving 8 ohms with zero feedback. Increasing the feedback gave a slight hint of overshoot (fig.4), this correlating with the sharper rolloff "corner" in the frequency response. The 1kHz squarewave response (fig.5) was superb.

Fig.3 Cayin A-300B, 4 ohm tap, zero negative feedback, small-signal 10kHz squarewave into 8 ohms.

Fig.4 Cayin A-300B, 4 ohm tap, high negative feedback, small-signal 10kHz squarewave into 8 ohms.

Fig.5 Cayin A-300B, 4 ohm tap, zero negative feedback, small-signal 1kHz squarewave into 8 ohms.
With its single-ended output stage and its necessarily limited negative feedback, the Cayin A-300B was never going to be a low-distortion design. Nevertheless, under the best conditions—the 4 ohm tap into 16 ohms with the highest level of feedback—the THD+noise percentage drops below 0.2% below 1W and below 0.1% at 300mW (fig.6, bottom trace). Reducing the amount of negative feedback slightly increases the THD percentage (fig.7), but overall, the main characteristic of these graphs is that the amount of THD increases in a linear manner with increasing power, due to increasing waveform asymmetry. Actual clipping is gentle, and the A-300B does meet its specified power of 8W (9dBW) at 2% THD as long as the load impedance is at least twice the magnitude of the transformer tap used.

Fig.6 Cayin A-300B, 4 ohm tap, high negative feedback, distortion (%)vs 1kHz continuous output power into (from bottom to top at 1W): 16, 8, 4, 2 ohms, one channel driven.
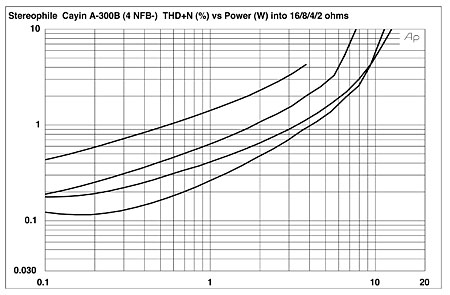
Fig.7 Cayin A-300B, 4 ohm tap, zero negative feedback, distortion (%)vs 1kHz continuous output power into (from bottom to top at 1W): 16, 8, 4, 2 ohms, one channel driven.
Because of the Cayin's limited output power, I plotted its THD+N percentage against frequency at a level of 1V. The results for the 4 ohm transformer tap with and without feedback are shown in figs.8 and 9, respectively. The THD rises at the top of the audioband but, more important, these graphs reinforce the impression that the A-300B needs to be used with speakers having an impedance at least equal to the nominal value of the transformer tap if the distortion is to remain moderate in level. Fig.10, for example, plots the THD+N percentage against frequency for the 6 ohm output tap, with zero feedback. The distortion rises to audible levels even with the 8 ohm load, while the amplifier is clearly under considerable stress into lower impedances.

Fig.8 Cayin A-300B, 4 ohm tap, high negative feedback, THD+N (%)vs frequency at 1V into (from bottom to top): 16, 8, 4, 2 ohms.

Fig.9 Cayin A-300B, 4 ohm tap, zero negative feedback, THD+N (%)vs frequency at 1V into (from bottom to top): 16, 8, 4, 2 ohms.

Fig.10 Cayin A-300B, 16 ohm tap, zero negative feedback, THD+N (%)vs frequency at 1V into (from bottom to top): 16, 8, 4, 2 ohms.
Fortunately, the Cayin's distortion is heavily low-order in nature (figs.11 and 12), with the increased THD seen into lower impedances (ie, higher currents) due primarily to an increase in the second harmonic. Increasing the amplifier's negative feedback drops the level of the distortion components by 2dB or so. Considering the decrease in linearity at high frequencies, the A-300B did surprisingly well on the punishing high-frequency intermodulation test (fig.13): the 1kHz difference component lay at –56dB (0.15%) with the 8 ohm tap (zero feedback) driving 4 ohms at a level just below visible waveform clipping. Several higher-order products can also be seen in this graph, however.
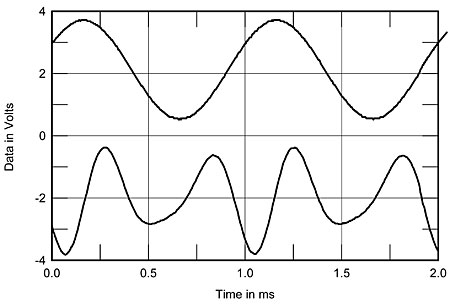
Fig.11 Cayin A-300B, 4 ohm tap, zero negative feedback, 1kHz waveform at 1W into 8 ohms (top), 0.44% THD+N; distortion and noise waveform with fundamental notched out (bottom, not to scale).

Fig.12 Cayin A-300B, 4 ohm tap, high negative feedback, spectrum of 50Hz sinewave, DC–1kHz, at 1W into 8 ohms (linear frequency scale).
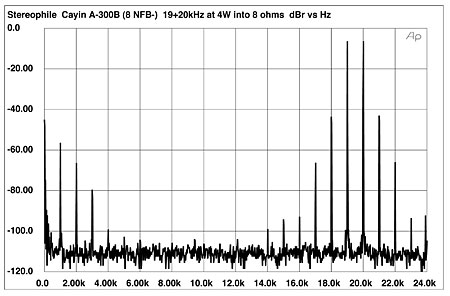
Fig.13 Cayin A-300B, 8 ohm tap, zero negative feedback, HF intermodulation spectrum, DC–24kHz, 19+20kHz at 4W peak into 8 ohms (linear frequency scale).
Taking into consideration the single-ended nature of its design, the Cayin measures surprisingly well, provided the speaker has an impedance that doesn't dip below the nominal value of the output transformer tap used and stays above twice that value for much of the audioband. And its excellent squarewave response and wide bandwidth are tributes to excellent output-transformer design.—John Atkinson
|
| ||||||||||
- Log in or register to post comments


| Loudspeakers Amplification Digital Sources | Analog Sources Accessories Featured | Music Columns Retired Columns | Show Reports | Features Latest News Community | Resources Subscriptions |
 © 2024 Stereophile
AVTech Media Americas Inc., USA
All rights reserved

