| Columns Retired Columns & Blogs |
Cary Audio Design SLM-100 monoblock power amplifier Measurements
Sidebar 3: Measurements
Following its one-hour, 1/3-power preconditioning test, the Cary SLM-100 was typically hot for a tube amplifier. Its voltage gain into 8 ohms measured 26.7dB, the input impedance a high 123.6k ohms. DC offset was effectively zero. The SLM-100 was non-inverting, a positive-going input emerging positive at the output. The unweighted S/N ratio (ref. 1W into 8 ohms) was 77.4dB over both 22Hz–22kHz and 10Hz–500kHz bandwidths. A-weighting improved the figure to 90dB. Despite Cary's claimed high damping factor, the SLM-100's output impedance varied between 5.4 ohms and a very high 8.8 ohms, depending on the load impedance I used to assess the value. This very high output impedance will cause significant frequency-response deviations into real loads.
Fig.1 shows the frequency response of the Cary SLM-100 under the conditions indicated in the caption. With our simulated loudspeaker load, the expected deviations due to the amplifier's high output impedance are quite visible, though it's interesting that they appear to be no more severe than with tube amplifiers we've measured that have lower but still high output impedances.

Fig.1 Cary SLM-100, frequency response (from top to bottom at 20kHz): at 2W into 4 ohms, 1W into 8 ohms, and 2W into simulated speaker load (0.5dB/vertical div.).
The output of the SLM-100 in response to a 10kHz squarewave is shown in fig.2. This is a good squarewave response for a tube amplifier: the risetime is short, there's no overshoot, and only a slight oscillation can be seen on the tops and bottoms of the waveform (these are too small to be easily visible here, but they're clear on a conventional 'scope trace). The 1kHz squarewave response (not shown) was also very good, with only a barely perceptible overshoot followed by a rapidly damped oscillation.

Fig.2 Cary SLM-100, small-signal 10kHz squarewave into 8 ohms.
Fig.3 shows the Cary's THD+noise level plotted against frequency. These results, not atypical for a tube amplifier, are neither exceptional nor disappointing, though I'd like to see a little less distortion at low frequencies. High low-order harmonics in the bass will often add warmth—pleasant though unnatural—to the sound, while harmonic distortion above about 8kHz will very likely be inaudible (the harmonic distortion alone of an 8kHz signal will add no artifacts below 16kHz). The Cary is clearly not intended to drive 2 ohm loads, as is obvious from figs.3 and 7 (see below).
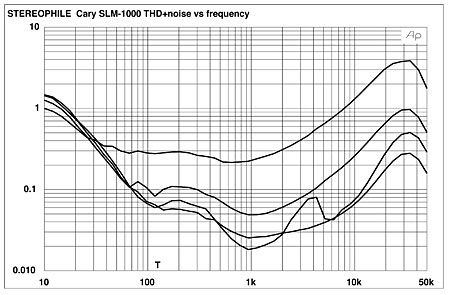
Fig.3 Cary SLM-100, THD+noise vs frequency at (from top to bottom at 20kHz): 4W into 2 ohms, 2W into 4 ohms, 2.83V into simulated speaker load, and 1W into 8 ohms.
The 1kHz THD+noise waveform at low power into 8 ohms (fig.4) is primarily second-harmonic, with some higher-order components and noise apparent. The results into 4 ohms were similar, though with more visible higher harmonics. The main component with a 2 ohm load was third-harmonic.

Fig.4 Cary SLM-100, 1kHz waveform at 1W into 8 ohms (top); distortion and noise waveform with fundamental notched out (bottom, not to scale).
Fig.5 shows the distortion spectrum resulting from a 50Hz input at 66.7W into 8 ohms (2/3 rated power). (Though we normally show this measurement into 4 ohms, the Cary is clearly optimized for 8 ohm loads.) The largest artifact is the third harmonic, at –42dB (0.8%). The distortion spectrum into a simulated speaker load (not shown) was similar in distribution though slightly different in magnitude (about 1.5% at the same third harmonic). This behavior is typical for a tube amplifier; ie, moderately high for a modern amplifier design.

Fig.5 Cary SLM-100, spectrum of 50Hz sinewave, DC–1kHz, at 66.7W into 8 ohms (linear frequency scale). Note that the third harmonic at 150Hz is the highest in level, at –42dB (0.8%).
The same can be said for the 19+20kHz intermodulation spectrum at 47.5W into 8 ohms (fig.6)—just below the level at which clipping is observed in the output waveform with this input signal. [This signal has a peak:mean ratio twice that of a sinewave, meaning that amplifiers will clip at about half their rated powers.—Ed.] The 1kHz difference-tone artifact is at –49dB referred to the level of each of the tones, or about 0.35%; the 18kHz component is –40.7dB, or just under 1%. The artifacts were slightly lower into 4 ohms (not shown), but the available power at clipping with this signal was slightly less with the lower impedance.

Fig.6 Cary SLM-100, HF intermodulation spectrum, DC–22kHz, 19+20kHz at 47.5W into 8 ohms (linear frequency scale).
The SLM-100's THD+noise vs level curves (at 1kHz) are shown in fig.7. The Cary's measured discrete clipping points (defined here as 1% THD+noise at 1kHz) were 99W (20dBW) into 8 ohms, 24.8W (10.9dBW) into 4 ohms, and just 9W (3.5dBW) into 2 ohms. (These measurements were all taken with a 116–117V AC line voltage.) You can see that the output power would have been significantly higher, especially into 2 or 4 ohm loads, had we chosen to define clipping as the 3% THD+noise level. The clipping would then have been at about 110W (20.4dBW) into 8 ohms, 90W (16.5dBW) into 4 ohms, and 40W (10dBW) into 2 ohms.
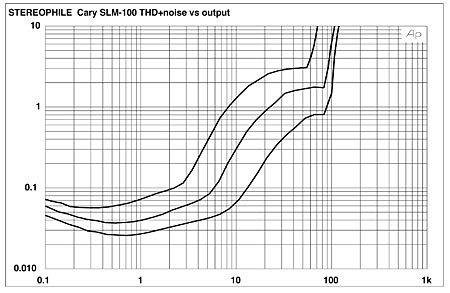
Fig.7 Cary SLM-100, distortion (%) vs output power into (from bottom to top): 8 ohms, 4 ohms, and 2 ohms.
The Cary SLM-100's test-bench performance was satisfactory for a tube amplifier, though its output impedance is a matter for concern. As with all amplifiers of high output impedance, the SLM-100's performance with any specific loudspeaker will not necessarily be representative of its performance with another.—Thomas J. Norton
|
|
| ||||||||||
- Log in or register to post comments


| Loudspeakers Amplification Digital Sources | Analog Sources Accessories Featured | Music Columns Retired Columns | Show Reports | Features Latest News Community | Resources Subscriptions |
 © 2024 Stereophile
AVTech Media Americas Inc., USA
All rights reserved

