| Columns Retired Columns & Blogs |
Bryston 7B NRB-THX, ST, & SST monoblock power amplifier Measurements
Sidebar 2: 7B Measurements
Following its one-hour, 1/3-power preconditioning, the Bryston 7B was hot all over—heatsinks, top, back, and front panel. Too hot to touch comfortably for more than an instant, it nevertheless continued to operate without malfunctioning. I should point out that this preconditioning test is a worst-case operating mode for a class-B output stage. In normal use, the 7Bs ran cool enough that you could leave a hand on them all day long.
As noted above, the Bryston 7B is actually two different amps, depending on whether it's hooked up in its series or parallel configuration. Though much of the auditioning was done in the parallel mode, I ran a complete set of measurements on each. Most of the measurements were made through the unbalanced input, though the input impedance, frequency response, signal/noise ratio, and THD+noise vs frequency were also measured using the balanced input. Those results are presented below.
Beginning with the series mode, the input impedance of the Bryston measured 9.9k ohms at the unbalanced input. Though this is to the THX spec—the non-THX amp has a 50k input impedance—it could present a problem with the occasional preamp having an unusually high output impedance. These are no longer all that common, but are more likely to be tube units (where unbalanced outputs are still the norm) than solid-state ones (where balanced outputs are becoming more and more common above a certain price point). In the balanced mode, the input impedance of the Bryston measured a more comfortable, though a lower than specified, 33k ohms. The gain was 29dB in both unbalanced and balanced modes. The output impedance was low—0.06 ohms up to 1kHz and 0.2-0.23 ohms at 20kHz, depending on load. This suggests a very consistent performance, at least with respect to overall amplifier/loudspeaker frequency response, with a wide range of loudspeakers. The Bryston's DC offset in this mode was non-existent—or at least too low to measure. S/N (unweighted, wideband ref. 1W into 8 ohms) measured 111dB with an unbalanced input, and virtually the same with a balanced one. The 7B was noninverting, a positive impulse at the input remaining positive at the output. In its balanced mode, XLR pin 3 was positive, pin 2 negative, the opposite of the AES standard.
Continuing with the series mode of operation, fig.1 shows the frequency response of the 7B with both balanced and unbalanced inputs into both 4 and 8 ohm loads. Note that the response is flattest at the higher impedance with an unbalanced input, but the difference below 20kHz is small. The 10kHz squarewave response is shown in fig.2. The Bryston has a good risetime, with only a slight rounding of the leading edge resulting from the top-end rolloff above the audible range. The 1kHz squarewave—not shown—shows only the hint of a slope at the top and bottom "plateaus" of the trace (indicative of very low frequency rolloff), and a barely perceptible overshoot.
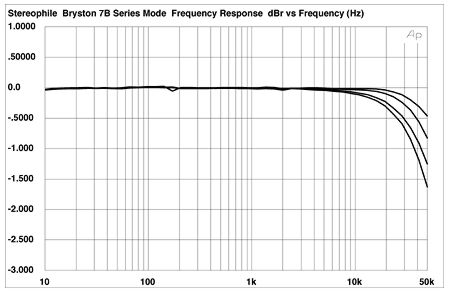
Fig.1 Bryston 7B, series mode, frequency response at (from top to bottom at 50kHz): 1W into 8 ohms, unbalanced; 1W into 8 ohms, balanced; 2W into 4 ohms, unbalanced; 2W into 4 ohms, balanced (0.5dB/vertical div.).
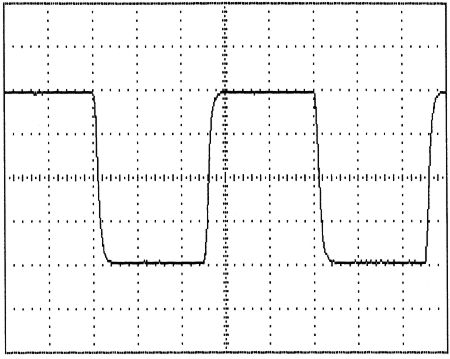
Fig.2 Bryston 7B, series mode, small-signal 10kHz squarewave into 8 ohms.
The low-power THD+noise vs frequency results in fig.3 are consistently low regardless of load, slightly but not appreciably higher above 2kHz at the lower impedances. Observation of the waveform indicates that much of the "distortion" measured at these low power levels was actually noise. This was also evident in the equivalent results from the balanced input, where the THD+noise—mostly the latter—was actually higher than that for the unbalanced input. Bryston's distortion measurements for our samples, furnished with the amplifiers, show slightly lower THD+noise, a difference most likely attributable to slight setup differences. At these low THD+noise levels, a minuscule difference in the noise can double the readings.
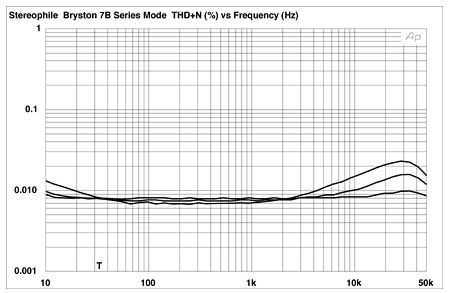
Fig.3 Bryston 7B, series mode, unbalanced THD+noise vs frequency at (from top to bottom) at: 4W into 2 ohms; 2W into 4 ohms; and 1W into 8 ohms.
This very low level of distortion, substantially buried in the noise, made it a challenge to resolve the Bryston's distortion waveform. To get the plot shown in fig.4, it was necessary to increase the power output substantially (96W into a 4 ohm load was selected here) and average 32 samples to minimize the noise. (The 'scope was triggered on the output signal itself to keep the distortion waveform from averaging to zero!) This plot shows that the main distortion component in the series mode is second harmonic.
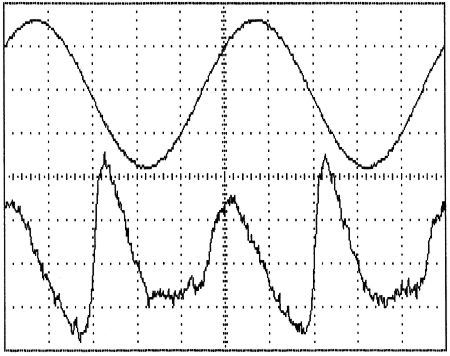
Fig.4 Bryston 7B, series mode, unbalanced 1kHz waveform at 96W into 4 ohms (top); distortion and noise waveform with fundamental notched out (bottom, not to scale).
Fig.5 shows the response of the Bryston to a 50Hz input at an output of 590W into a 4 ohm load. Even at this prodigious power output (causing me some concern for the safety of our test-bench load) the distortion artifacts are negligible. The largest—the seventh harmonic at 350Hz—is at -92dB, or about 0.0025%. Fig.6 shows the artifacts (IM distortion) in response to a combined 19+20kHz signal at 405W output into 4 ohms, a level just below visible signs of clipping with this test signal. The highest artifact here—at 18kHz—is -80.6dB or about 0.01%. The 1kHz difference signal is buried in the noise. The response (not shown) to the same signal into an 8 ohm load at 246.5W—again, just prior to clipping with this signal—had no artifacts above 0.007% (occurring at 18kHz and 21kHz), with the 1kHz difference signal similarly difficult to see.
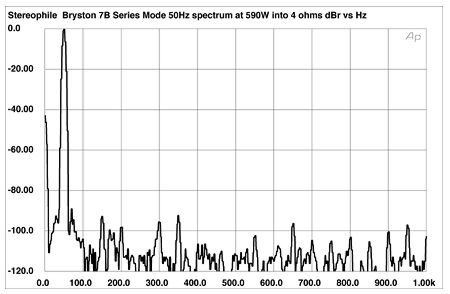
Fig.5 Bryston 7B, series mode, unbalanced spectrum of 50Hz sinewave, DC-1kHz, at 590W into 4 ohms (linear frequency scale).
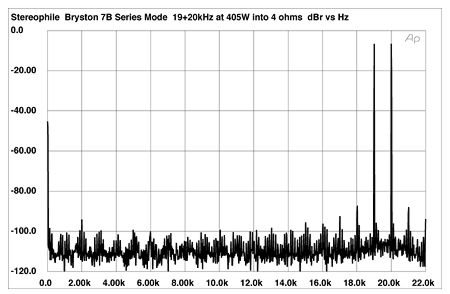
Fig.6 Bryston 7B, series mode, unbalanced HF intermodulation spectrum, DC-22kHz, 19+20kHz at 405W into 4 ohms (linear frequency scale).
The THD+noise vs level curves for the series-operated 7B are shown in fig.7. Since this is for the series mode, measurements were only taken at 4 and 8 ohms—a 2 ohm load is not advisable in this configuration. The output here is impressive, almost 400W into 8 ohms (26dBW) and 600W into 4 ohms (24.8dBW) at the break-point, or knee, of the distortion curve, with significant additional power available up to the 1% distortion point. The actual discrete clipping-point measurements (clipping point here conventionally defined as the 1% distortion point) were 499W (27dBW), 111.5V line, into an 8 ohm load, and 759W (25.8dBW), 109.5V line—the wall voltage sagged a bit at this power output!—into a 4 ohm load. It's not at all uncommon for amplifiers, particularly moderately priced ones, that are putting out this kind of power to blow fuses while these measurements are being made.
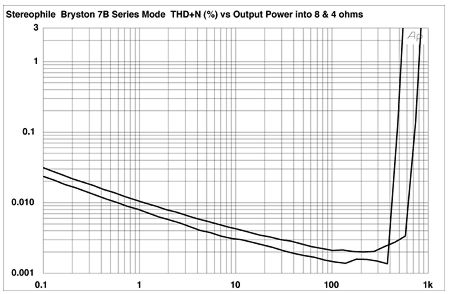
Fig.7 Bryston 7B, series mode, distortion (%) vs output power into (from bottom to top): 8 ohms and 4 ohms.
No fuses blew in the Bryston at any time, even though it was occasionally necessary to hold these high powers for a few seconds to allow the test set to stabilize enough to take a reading. A compartment on the outside rear holds two powerline fuses. The internal fuses I saw—additional line fuses in series with the outside ones, only one amp larger in value—are designed to prevent someone from putting an overvalued fuse in the outside compartment. There are no B+ fuses.
Moving to the parallel operating mode, the Bryston's input impedance remained virtually unchanged from the series mode—9.9k ohms unbalanced, 33k ohms balanced. (Both here and in the series results, the impedances were rounded to the nearest 100 ohms.) The gain was also unchanged at 29dB. The output impedance remained below 0.05 ohms up to 1kHz and under 0.09 ohms at 20kHz, depending on load. The Bryston's DC offset in this mode was 1mV, its S/N ratio (unweighted at 1W into 8 ohms) measured around 111dB with both unbalanced and balanced inputs.
Fig.8, still in the parallel mode, shows the frequency response of the 7B with both balanced and unbalanced inputs into both 4 and 8 ohm loads. Here the response remains flattest with the unbalanced input, though there is little significant difference within the audible range. The parallel-mode squarewaves are not shown because they are little changed from those in the series mode—a very slightly more perceptible, but still insignificant, overshoot of the waveform at both 1kHz and 10kHz being present.
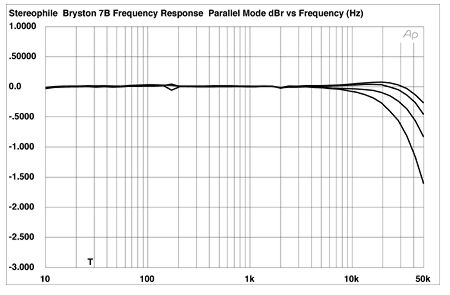
Fig.8 Bryston 7B, parallel mode, frequency response at (from top to bottom at 50kHz): 1W into 8 ohms, unbalanced; 2W into 4 ohms, unbalanced; 1W into 8 ohms, balanced; 2W into 4 ohms, balanced (0.5dB/vertical div.).
As was the case in series operation, the unbalanced parallel-mode, low-power THD+noise vs frequency result in fig.9 was still largely noise—with, as before, a level higher for the balanced input. The averaged distortion waveform for the parallel mode in fig.10 now shows a primarily third-order component as contrasted with the second-order result for the series-connected 7B.
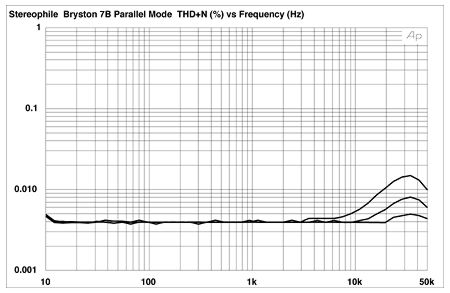
Fig.9 Bryston 7B, parallel mode, unbalanced THD+noise vs frequency at (from top to bottom) at: 4W into 2 ohms; 2W into 4 ohms; and 1W into 8 ohms.
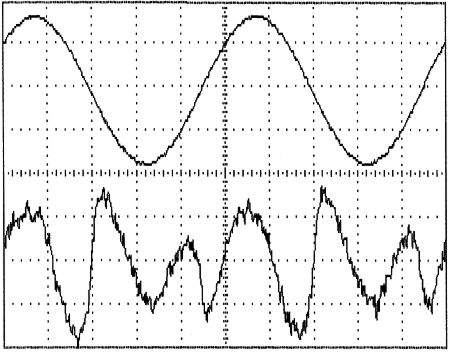
Fig.10 Bryston 7B, parallel mode, unbalanced 1kHz waveform at 96W into 4 ohms (top); distortion and noise waveform with fundamental notched out (bottom, not to scale).
Fig.11 plots the response of the Bryston to a 50Hz input at an output of 207W into a 4 ohm load. The artifacts remain negligible, the largest being the third at -96dB, or 0.0015%. Fig.12 shows the intermodulation artifacts caused by a combined 19+20kHz input signal at 148W output into 4 ohms (just below the level at which this signal causes the output to clip). The largest artifacts here—at 18kHz and 21kHz—are at just under -83dB, or 0.007%. The 1kHz difference signal, hard to spot in the series connection, here is a clearly measurable (if still very low) -89.4dB, or about 0.003%. The response to the same signal into a 2 ohm load at 249W (again just prior to clipping with this signal) is shown in fig.13. While clearly less pristine than the result into 4 ohms, the largest artifacts here—at 15kHz and 17kHz—are still at about -80dB, or 0.01%. (Note that we normally take these measurements at 8 and 4 ohms, but because of the specific low-impedance load capabilities of the Bryston in its parallel connection, we judged 4 and 2 ohm loads to be of more interest here.)
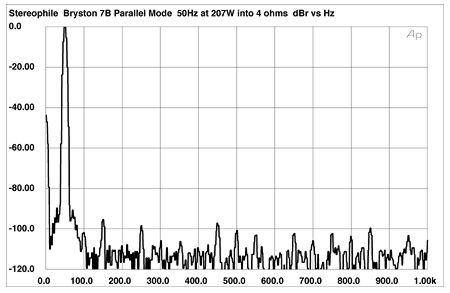
Fig.11 Bryston 7B, parallel mode, unbalanced spectrum of 50Hz sinewave, DC-1kHz, at 207W into 4 ohms (linear frequency scale).
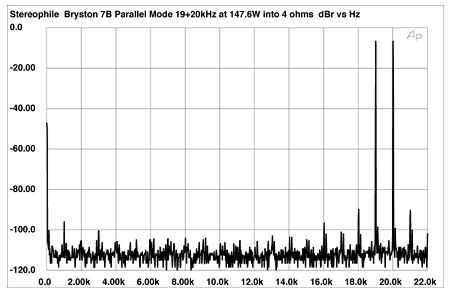
Fig.12 Bryston 7B, parallel mode, unbalanced HF intermodulation spectrum, DC-22kHz, 19+20kHz at 147.6W into 4 ohms (linear frequency scale).
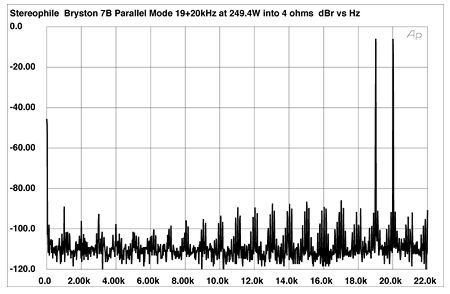
Fig.13 Bryston 7B, parallel mode, unbalanced HF intermodulation spectrum, DC-22kHz, 19+20kHz at 249.4W into 4 ohms (linear frequency scale).
The THD+noise vs level curves for the 7B in the parallel mode are shown in fig.14. Here, although the parallel mode 7B is recommended for low-impedance loads, an 8 ohm reading was also taken. And, unlike the case with the series mode where we omitted the low-impedance 2 ohm load, using a higher than optimal impedance should not cause any undue strain on a solid-state amplifier. While less power is available here than in the series mode, at the lower impedances for which this mode is designed the power output is still substantial. While I would be inclined to use the series connection for a 4 ohm load if the additional power available in that mode were needed, any significant dip of the loudspeaker impedance curve below 4 ohms would likely prompt me to use the parallel mode.
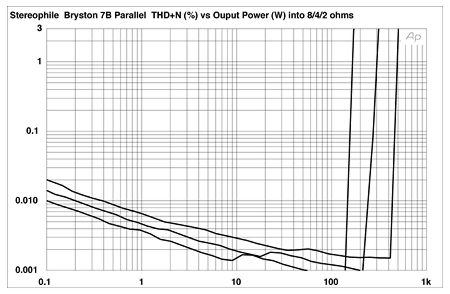
Fig.14 Bryston 7B, parallel mode, distortion (%) vs output power into (from bottom to top): 8 ohms, 4 ohms, and 2 ohms.
The parallel-mode, discrete clipping-point measurements (defined here as the 1% distortion point) were 156W (21.9dBW), 112.5V line, into an 8 ohm load; 295W (21.7dBW), 115V line, into a 4 ohm load; and 478W (20.8dBW), 112V line, into a 2 ohm load.
The measured performance of the Bryston 7B, particularly its tremendous power output at very low distortion, is first-class in every respect. It refused to be tripped-up in any way.—Thomas J. Norton
NEXT: 7B-ST October 1996 »
|
|
| ||||||||||
- Log in or register to post comments


| Loudspeakers Amplification Digital Sources | Analog Sources Accessories Featured | Music Columns Retired Columns | Show Reports | Features Latest News Community | Resources Subscriptions |
 © 2024 Stereophile
AVTech Media Americas Inc., USA
All rights reserved

