| Columns Retired Columns & Blogs |
Bow Technologies Wazoo integrated amplifier Measurements
Sidebar 3: Measurements
As Kal Rubinson describes, the Wazoo's input impedance was very low, with some dependence on the volume-control setting. With the control at its maximum position, the input load was just 914 ohms, which will lead to a bass-light presentation with CD players having a high source impedance at low frequencies. And some sources will have difficulty driving such a load at all. Reducing the volume control to a more realistic 12:00 position increased the load impedance slightly, to 1106 ohms—still very low. The output impedance varied from 0.68 ohms to 0.82 ohms depending on the frequency and channel; in this behavior the Wazoo is more like a tube design.
The amplifier didn't invert absolute phase. The maximum voltage gain available was 32.5dB, 320mV input being required for clipping into 8 ohms with the volume control at its maximum. Into 4 ohms, however, the amplifier proved unstable unless the volume control was set below 3:00 or so, the reproduced waveform otherwise being overlaid by ultrasonic oscillations. I have seen this in other integrated amplifiers that place a passive volume control and input switching section ahead of a high-gain power section. In practice, an amplifier like this will never be used with the volume control set to its maximum, but this behavior does indicate a potentially unstable design.
The frequency response also varied with the volume-control setting, as can be seen from fig.1, which plots the Wazoo's response up to 200kHz, a decade above the audio band. With the volume control set to 12:00 and the amplifier driving 8 ohms (bottom pair of traces), the response is flat over most of the audio band, with a very slight excess of energy apparent in the high treble before a smooth rolloff to –2dB at the graph's upper frequency limit. Reducing the load to 4 ohms but keeping the control set to 12:00 gives a small peak around 110kHz, the frequency at which the amplifier eventually oscillates when the volume control is rotated to its maximum (next-to-bottom pair of traces). The same small peak can be seen into 8 ohms when the volume control is increased to the 4:30 position (second-from-top traces), and even more so with the control at maximum, into 8 ohms (top traces).
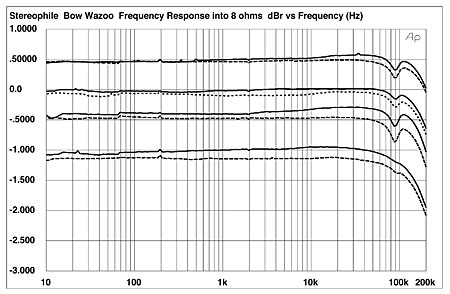
Fig.1 Bow Technologies Wazoo, frequency response at (from top to bottom): 1V into 8 ohms, volume control maximum; 1V into 8 ohms, volume control at 4:30; 1V into 4 ohms, volume control at 12:00; and 1V into 8 ohms, volume control at 12:00. (0.5dB/vertical div., right channel dashed.)
The same instability makes its presence known in the time domain. Fig.2 shows the waveform of a small-signal 10kHz squarewave into an 8 ohm load. Just visible is a small overshoot at each transition point. Adding a 2µF capacitor to the 8 ohms in order to simulate a very reactive loudspeaker accentuates the overshoot significantly (fig.3) and gives rise to two cycles of oscillation on each wave top, the fundamental ringing frequency again being around 110kHz.
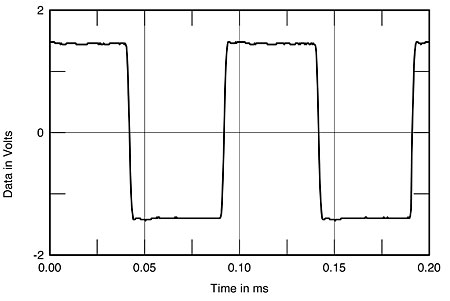
Fig.2 Bow Technologies Wazoo, small-signal 10kHz squarewave into 8 ohms.
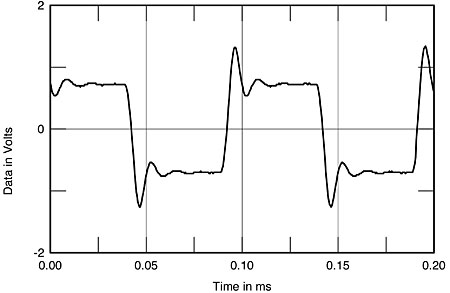
Fig.3 Bow Technologies Wazoo, small-signal 10kHz squarewave into 8 ohms+2µF.
Channel separation was also dependent on volume-control setting. With the control set at maximum, the crosstalk in either direction straddled the –40dB mark (fig.4, top traces), which is not good. However, backing off the volume control to the 12:00 position gave an improvement in separation of just over 10dB, pretty much the amount of gain reduction with the volume control in this position. The left-to-right upward slope of the crosstalk curves suggests the presence of capacitive coupling between the channels.

Fig.4 Bow Technologies Wazoo, L–R crosstalk with volume control set to maximum (top) and to 12:00 (bottom) (R–L crosstalk dashed).
Again like a tube amplifier, the Wazoo offered relatively high levels of measured distortion (fig.5), this increasing into lower loads. The distortion at low levels and into higher loads appeared to be predominantly second-harmonic. But as the level increased or the load decreased, the content became predominantly third-harmonic (fig.6).
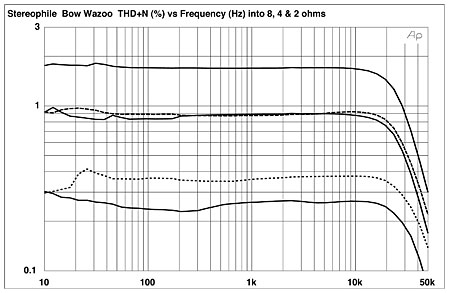
Fig.5 Bow Technologies Wazoo, THD+noise vs frequency at (from top to bottom at 20kHz): 4W into 2 ohms, 2W into 4 ohms, and 1W into 8 ohms (right channel dashed).
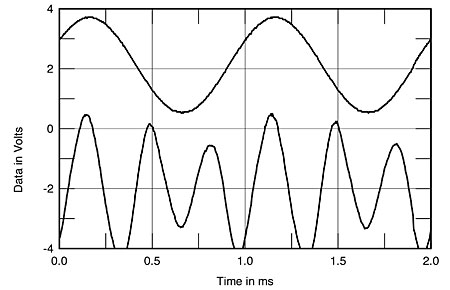
Fig.6 Bow Technologies Wazoo, 1kHz waveform at 1V into 4 ohms (top), distortion and noise waveform with fundamental notched out (bottom, not to scale).
As a result of its "bent" transfer function, the Wazoo did rather poorly on the high-frequency intermodulation test. Fig.7 shows the spectrum of its output when driving a 4 ohm load with a mixture of 19kHz and 20kHz tones at an indicated 10W level (just below clipping with this demanding signal). The 1kHz difference tone and the second-order tones at 18kHz and 21kHz all rise above the –60dB (0.1%) level, with a regular array of other products visible, spaced at 1kHz intervals. Increasing the load to 8 ohms dropped the level of intermodulation products slightly (not shown), but the basic behavior remained the same.
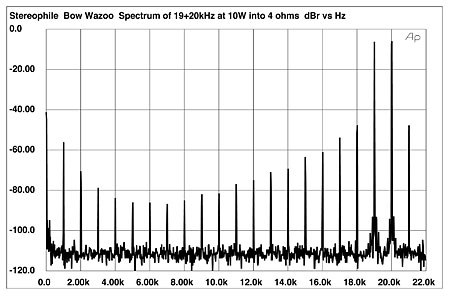
Fig.7 Bow Technologies Wazoo, HF intermodulation spectrum, DC–22kHz, 19+20kHz at 10W into 4 ohms (linear frequency scale).
Plotting the continuous output power into 8, 4, and 2 ohms (fig.8) proved interesting: the Wazoo appeared to behave like a single-ended tube amplifier. Its distortion was acceptably low at low levels, 100mW to 1W—it's a good thing that, with music played at "normal" levels with a typical 8 ohm loudspeaker in a typical room, this is all the power that will be required—but increased with increasing power to levels that might be audible. I am not surprised KR found problems trying to drive the Apogee ribbons with the Wazoo.
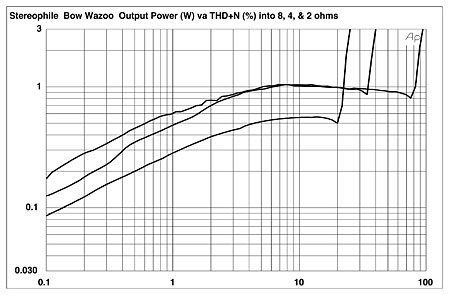
Fig.8 Bow Technologies Wazoo, distortion (%) vs continuous output power into (from bottom to top): 8 ohms, 4 ohms, and 2 ohms (one channel driven).
The clipping point was accompanied by a visible rounding-off of the top peak on the oscilloscope screen, while the bottom peak remained cleanly defined, which is akin to the way a single-ended design clips. The actual continuous power available at clipping was below specification, even with the definition of clipping relaxed to 3% THD+noise: 22.6W into 8 ohms (13.55dBW), 36.7W into 4 ohms (12.65dBW), and 55W into 2 ohms (11.4dBW). I wondered if something was wrong with the amplifier, but the power-supply voltages appeared to be healthy—separate twin 24V AC supplies to the low-level circuitry, 100V AC supplies to the output stages, for each channel—and no fuses appeared to be blown. As the two channels behaved identically, this would rule out a component failure.
Using the Miller Audio Research Amplifier Profiler to determine the output power (one channel driven) with a low-duty-cycle 1kHz pulsed waveform gave the curves shown in fig.9. The black curve plots output power against the THD+N percentage into 8 ohms, the red curve into 4 ohms, the blue curve into 2 ohms, and the green curve into 1 ohm. More power is available at the 3% limit with the pulsed signal than with a continuous sinewave: 32W into 8 ohms, 55W into 4 ohms, 121W into 2 ohms, and 178W into 1 ohm. But note the peculiar shape of the curves—the amplifier actually becomes more linear as more current is drawn from it! Note also the "furriness" of the curves. As this test was being performed, the Wazoo's distortion into the lower impedances kept increasing slightly, then decreasing.
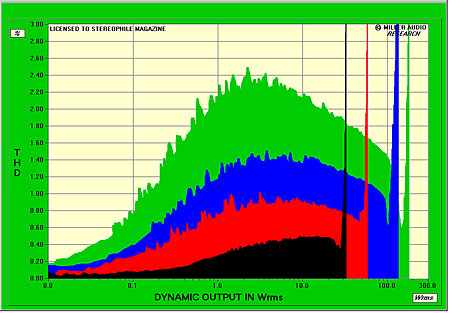
Fig.9 Bow Technologies Wazoo, distortion (dB) vs dynamic output power into 8 ohms (black), 4 ohms (red), 2 ohms (green), and 1 ohm (blue) (one channel driven).
The Wazoo's measured performance is enigmatic. Does it sound good despite its measurements, or because of them?
Then, of course, we heard from Bo Christensen that the driver-stage bias had been wrongly set on our review sample of the Wazoo, which explained both the asymmetrical clipping and the below-spec power delivery. I measured the second sample before sending both it and the original sample to Kal Rubinson for further listening tests. Fig.10 shows the variation of the second Wazoo's THD+noise percentage with frequency at 2.83V into 8, 4, and 2 ohms. If you compare it with fig.5, you can see that the second sample is not really any more linear than the first. This appears not to be a particularly low-distortion design.
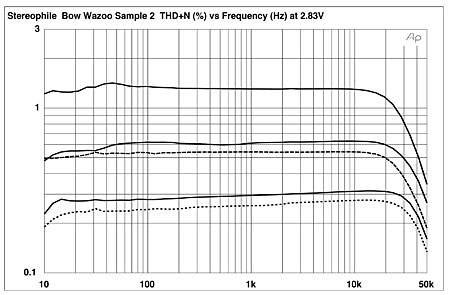
Fig.10 Bow Technologies Wazoo, Sample 2, THD+noise vs frequency at (from top to bottom at 20kHz): 4W into 2 ohms, 2W into 4 ohms, and 1W into 8 ohms (right channel dashed).
This is also apparent in fig.11, which shows the spectrum of the Wazoo's output while it reproduces a 50Hz sinewave at 52W into 4 ohms. This is a high output level for the amplifier, and the second harmonic at 100Hz lies at a high 1% level (–40dB). But higher in frequency, a regular and decreasing series of odd harmonics can be seen; these might fatten up the sound as well as add a bit of presence.
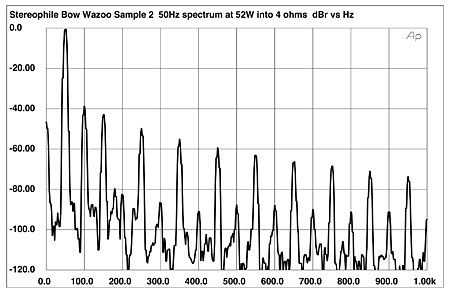
Fig.11 Bow Technologies Wazoo, Sample 2, output spectrum, DC–1kHz, 50Hz at 52W into 4 ohms (linear frequency scale).
At least this second sample delivers very much more power than the first. Fig.12 is a repeat of the fig.9 dynamic power test, this time for Wazoo Two. While the shape of the change in distortion level with output power is broadly similar, there is now a more regular increase in THD and a clipping point significantly higher. Into 8 ohms, for example, 64.8W is available at a relaxed 3% THD limit (20.5W was available at the usual 1% limit). Into 4 ohms, the Bow put out 113.3W (3% THD); into 2 ohms, 167.2W was available. But as can be seen from fig.12, with the Wazoo driving the punishing 1 ohm load, the levels of distortion at low powers were much higher, and the maximum power available only slightly greater, than into 2 ohms at 200W.—John Atkinson
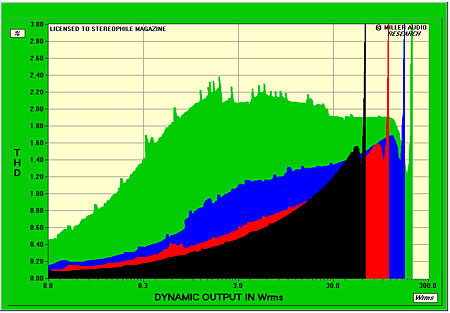
Fig.12 Bow Technologies Wazoo, Sample 2, distortion (dB) vs dynamic output power into 8 ohms (black), 4 ohms (red), 2 ohms (green), and 1 ohm (blue) (one channel driven).
|
| ||||||||||
- Log in or register to post comments


| Loudspeakers Amplification Digital Sources | Analog Sources Accessories Featured | Music Columns Retired Columns | Show Reports | Features Latest News Community | Resources Subscriptions |
 © 2024 Stereophile
AVTech Media Americas Inc., USA
All rights reserved

