| Columns Retired Columns & Blogs |
Boulder 865 integrated amplifier Measurements
Sidebar 3: Measurements
I examined the Boulder 865's measured behavior using mainly Stereophile's loaner sample of the top-of-the-line Audio Precision SYS2722 system (see the January 2008 "As We See It" and www.ap.com); for some tests, I also used my vintage Audio Precision System One Dual Domain.
Before performing any tests on an amplifier, I run it for 60 minutes at one-third its specified power into 8 ohms, which is thermally the worst case for an amplifier with a class-B or -AB output stage. The Boulder's top panel was quite warm at the end of this period, but soon thereafter the amplifier turned itself off, due, presumably, to thermal overload. Following that, it turned itself on, then off, and so on, indicating that its heatsinks' thermal capacity is only just enough to pass this test. It is extremely unlikely that this will lead to any practical problems. Still, those using an 865 in home-theater systems would be well advised not to place it in a closet without adequate ventilation.
The 865's maximum voltage gain into 8 ohms from its speaker terminals was a high 45.85dB, and the volume control operated in accurate 0.5dB steps. The maximum gain from the Auxiliary line-level output was a fairly high 20dB, sourced from an output impedance of 984 ohms. Both speaker and Auxiliary outputs preserved absolute polarity; ie, were non-inverting with pin 2 of the XLR jacks wired as hot. The 865's input impedance was a high 63k ohms at 1kHz, rising to 84k ohms at 20Hz and 73k ohms at 20kHz.
The Boulder's output impedance was a low 0.07 ohm at low and midrange frequencies, this rising slightly to 0.1 ohm at 20kHz. As a result, the modification of the 865's frequency response due to the Ohm's Law interaction between it and the source impedance of our simulated loudspeaker (fig.1, gray trace) remained within ±0.1dB limits. The 865's small-signal bandwidth is wide, at –3dB at 90kHz, and commendably didn't change with different volume-control settings. The amplifier's increasing source impedance in the top octave and above did reduce the ultrasonic bandwidth slightly, but the Boulder's reproduction of a 10kHz squarewave was nicely square, with no overshoot or ringing (fig.2). The 1kHz squarewave performance was nigh on perfect (not shown).

Fig.1 Boulder 865, frequency response at 2.83V into: simulated loudspeaker load (gray), 8 ohms (left channel blue, right red), 4 ohms (left cyan, right magenta), 2 ohms (green). (1dB/vertical div.)

Fig.2 Boulder 865, small-signal 10kHz squarewave into 8 ohms.
Channel separation (not shown) was excellent, measured with the volume control at "0.0dB" (ie, its maximum setting), at better than 90dB in both directions below 1kHz, and still better than 80dB at 20kHz. The wideband, unweighted signal/noise ratio (ref. 2.83V into 8 ohms, with the input shorted but the volume control at its maximum, which is the worst case) was good but not great at 62.6dB, this improving to 69.3dB when the measurement bandwidth was restricted to the audioband, and to 71.8dB when A-weighted. This is not as good as the specified unweighted figure of 108dB, ref. 150W into 8 ohms, which is equivalent to 86.2dB ref. 2.83V.
Fig.3 plots the percentage of THD+noise in the Boulder 865's output while it drove an increasing level of a 1kHz tone into 8, 4, and 2 ohms. The amplifier easily exceeded its specified maximum continuous power of 150Wpc into 8 ohms, not clipping (defined as 1% THD) until 194W (22.9dBW) with both channels driven. It just met the specified peak output power of 300Wpc into 4 ohms, delivering 308Wpc at 1% THD (21.9dBW). With one channel driven into 2 ohms, the amplifier turned itself off at 467W into 2 ohms (20.7dBW), as indicated by the truncated upper trace in fig.3. The Boulder turned itself on again after I reduced the input level, but some residual crossover distortion was now apparent in its output. Cycling the amplifier off, then on again eliminated the crossover artefacts, but this behavior does suggest the 865 not be driven to high levels into low impedances of 2 ohms and below.

Fig.3 Boulder 865, distortion (%) vs 1kHz continuous output power into (from bottom to top): 8, 4 ohms.
I plotted the THD+N percentage against frequency at a level of 16V into 8 ohms, or 32W (fig.4). Though the measurement is dominated by noise below 4kHz or so into 8 ohms (blue and red traces) and 4 ohms (cyan and magenta traces), the THD does start to rise out of that noise above that frequency, if not to any significant level. Into 2 ohms, however, the distortion rises considerably above 1kHz, and the amplifier again shut itself off at the end of the time it took to take this measurement into that impedance (the power level was 128W into 2 ohms), which again suggests that the 865 is not optimized for driving impedances lower than 4 ohms.

Fig.4 Boulder 865, THD+N (%) vs frequency at 16V into: 8 ohms (left channel blue, right red), 4 ohms (left cyan, right magenta), 2 ohms (green).
The waveform of that distortion is dominated by the subjectively innocuous second and third harmonics (fig.5)—note how, even at the fairly high power level in this graph, the waveform is dominated by noise—though spectral analysis indicates that some higher-order harmonics are present (fig.6). The right channel is not quite as linear as the left, and in fig.6 you can also see some power-supply–related spuriae below 1kHz. Though these components are all at a very low level, I couldn't eliminate them by experimenting with grounding, and they do contribute to the worse-than-specified S/N ratio. Halving the load impedance to 4 ohms but keeping the input voltage constant gave the spectrum shown in fig.7. The distortion components haven't risen by much, but the spectral line representing the 1kHz tone now has sidebands apparent at the supply-related frequency of ±120Hz and its harmonics. The amplifier is obviously under strain at this high a power into 4 ohms, even though it doesn't actually clip for another couple of dB.
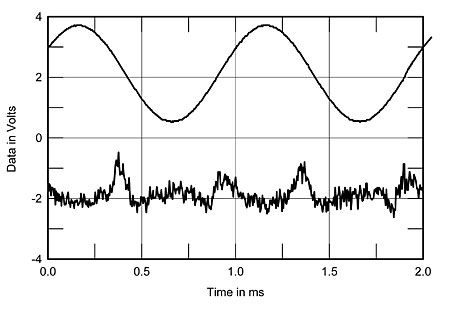
Fig.5 Boulder 865, 1kHz waveform at 93.5W into 4 ohms (top), 0.0044% THD+N; distortion and noise waveform with fundamental notched out (bottom, not to scale).

Fig.6 Boulder 865, spectrum of 1kHz sinewave, DC–1kHz, at 105W into 8 ohms (left channel blue, right red; linear frequency scale).

Fig.7 Boulder 865, spectrum of 1kHz sinewave, DC–1kHz, at 203W into 4 ohms (left channel blue, right red; linear frequency scale).
The Boulder 865 did well on the demanding high-level, high-frequency intermodulation test (fig.8). Though some higher-order components can be seen, these are all at a low level, and the 1kHz difference component lies at –110dB (0.0003%), which isn't going to disturb any listener's equanimity.

Fig.8 Boulder 865, HF intermodulation spectrum, DC–24kHz, 19+20kHz at 100W peak into 8 ohms (linear frequency scale).
The Boulder 865 measures well, though it clearly is having to work hard driving high powers into low impedances.—John Atkinson
|
|
| ||||||||||
- Log in or register to post comments


| Loudspeakers Amplification Digital Sources | Analog Sources Accessories Featured | Music Columns Retired Columns | Show Reports | Features Latest News Community | Resources Subscriptions |
 © 2024 Stereophile
AVTech Media Americas Inc., USA
All rights reserved

