| Columns Retired Columns & Blogs |
B.M.C. Audio Amplifier C1 integrated amplifier Measurements
Sidebar 3: Measurements
To perform the measurements on the B.M.C. Amplifier C1, I used Stereophile's loan sample of the top-of-the-line Audio Precision SYS2722 system (see www.ap.com and the January 2008 "As We See It"). Before testing the B.M.C., I ran both channels at 1/3 the rated power into 8 ohms for 60 minutes, which thermally is the worst case for an amplifier with a class-A/B output stage. At the end of that time the C1's chassis was too hot to touch, at 145°F (62.9°C), but the amplifier was otherwise operating correctly.
The volume control operated in 66 accurate 1dB steps, with the unity gain setting an indicated "39" for balanced inputs, "33" for unbalanced. The voltage gain at 1kHz into 8 ohms using the balanced XLR inputs was lower than usual for an integrated amplifier, at 27.16dB. Unusually, the gain using the unbalanced RCA jacks was 6dB higher. Both inputs preserved absolute polarity (ie, were non-inverting), the input XLR jacks wired with pin 2 hot. The unbalanced input impedance was 30k ohms at low and middle frequencies, dropping to 28k ohms at the top of the audioband. The balanced input impedance was more than twice this value, at 89k ohms.
The output impedance, including 6' of speaker cables, was low at <0.1 ohm at 20Hz and 1kHz, rising slightly to 0.13 ohm at 20kHz. As a result, the modulation of the Amp C1's frequency response, due to the Ohm's Law interaction between this output impedance and the impedance of our standard simulated loudspeaker, was just ±0.1dB (fig.1, gray trace). This graph shows that the amplifier's response was flat from 10Hz up to 20kHz into 4 and 8 ohms, but started to roll off above the audioband into 2 ohms (green trace), reaching –0.25dB at 20kHz. The C1's wide bandwidth into higher impedances results in a well-defined 10kHz squarewave (fig.2). Figs.1 and 2 were taken with the volume control set to unity gain. As Carlos Candeias admitted to Mikey, there is some restriction of the amplifier's bandwidth when the volume control was set at or close to its maximum. The red and blue traces in fig.3 were taken with the control at "66"—the response is down by 1.8dB at 10Hz and 3.6dB at 20kHz. Reducing the setting to "60" brought up the level at 20kHz by 2.5dB (cyan and magenta traces), but the response wasn't flat within the audioband until the volume was reduced another 6dB, to "54" (green and gray traces). But as Carlos Candeias said, this will not be an issue with practical sources, such as CD players, which will require lower settings of the volume control.
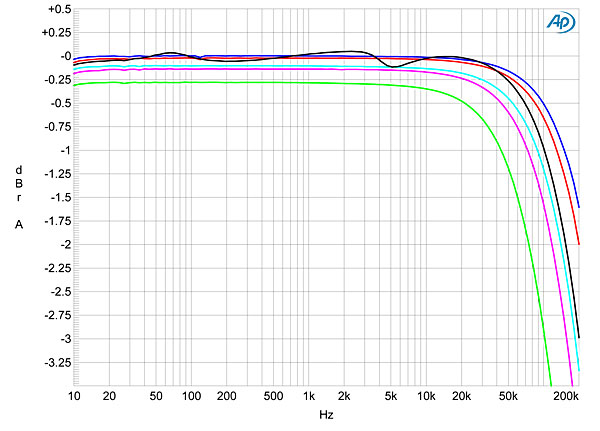
Fig.1 B.M.C. Amplifier C1, frequency response at 2.83V into: simulated loudspeaker load (gray), 8 ohms (left channel blue, right red), 4 ohms (left cyan, right magenta), 2 ohms (green) (0.25dB/vertical div.).
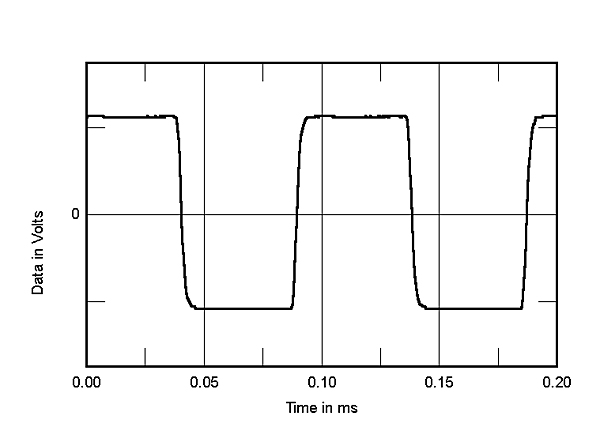
Fig.2 B.M.C. Amplifier C1, small-signal 10kHz squarewave into 8 ohms.
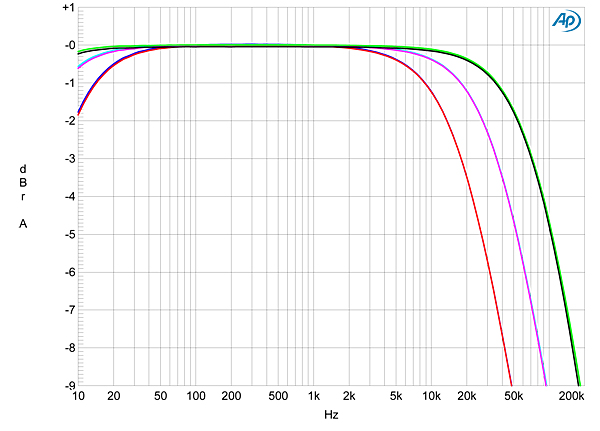
Fig.3 B.M.C. Amplifier C1, frequency response at 2.83V into 8 ohms with volume control set to: "66" (left channel blue, right red), "60" (left cyan, right magenta), "54" (left green, right gray) (1dB/vertical div.).
The B.M.C.'s channel separation was superb, at 110dB in both directions below 2kHz, and a still-excellent 90dB at 20kHz. The wideband, unweighted signal/noise ratio, taken with the input short-circuited and the volume control set to its maximum—very much a worst-case situation—was good rather than great at 72.1dB in the left channel and 74.1dB in the right, both referenced to 1W into 8 ohms. A-weighting improved these ratios to 76.7 and 78.7dB, respectively. And, as can be seen in fig.4, there are also some low-level hum components at the odd-order harmonics of the AC supply, in addition to the usual random noise. These components are presumably due to magnetic interference from the massive toroidal transformer that dominates the amplifier's interior.
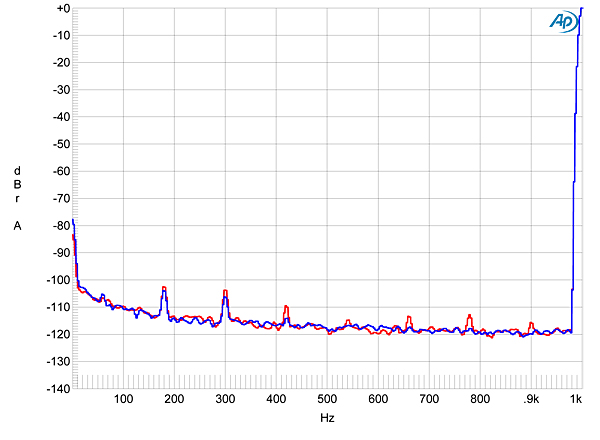
Fig.4 B.M.C. Amplifier C1, spectrum of 1kHz sinewave, DC–1kHz, at 20W into 8 ohms (linear frequency scale).
The Amp C1's front-panel power meters appeared to be correctly calibrated into 4 ohms. Fig.5 plots the THD+noise percentage in the C1's output against power into 8 ohms. Actual distortion starts to rise out of the noise floor above 4W or so, when the THD+N is just 0.011%. With actual waveform clipping defined as the point where the THD+N reaches 1%, the C1 slightly exceeds, at 180Wpc (22.5dBW), its power specification of 175Wpc. Into 4 ohms, however, it falls short of the specified 330Wpc by just under 1dB, outputting 275Wpc into 4 ohms (21.4dBW, fig.6). The Amp C1 did reach 330Wpc at 3% THD+N, however, and it's fair to note that I don't hold the AC wall voltage constant for these tests. Fig.7 shows how the THD+N varied with output power into 2 ohms; the C1 was less comfortable with this load, clipping at just 240W (17.8dBW).
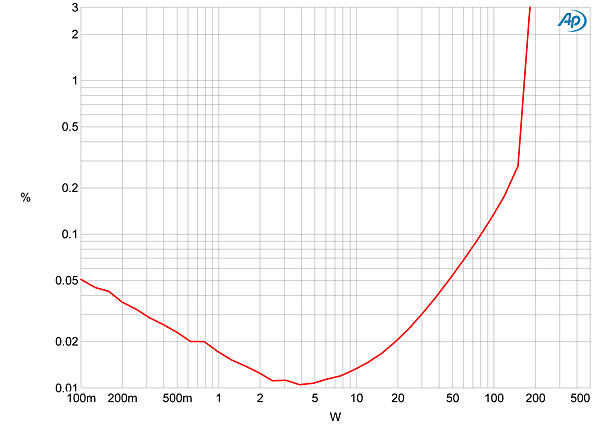
Fig.5 B.M.C. Amplifier C1, distortion (%) vs 1kHz continuous output power into 8 ohms.
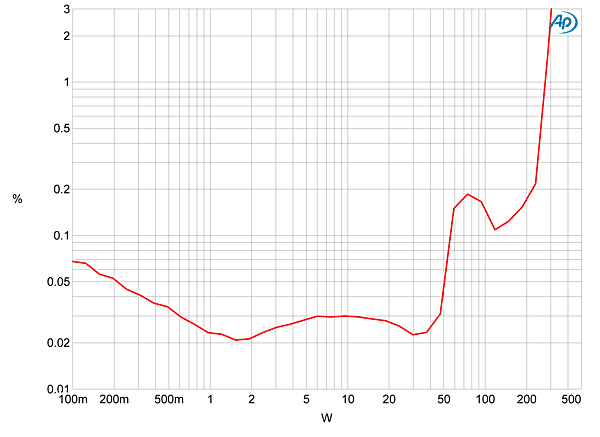
Fig.6 B.M.C. Amplifier C1, distortion (%) vs 1kHz continuous output power into 4 ohms.
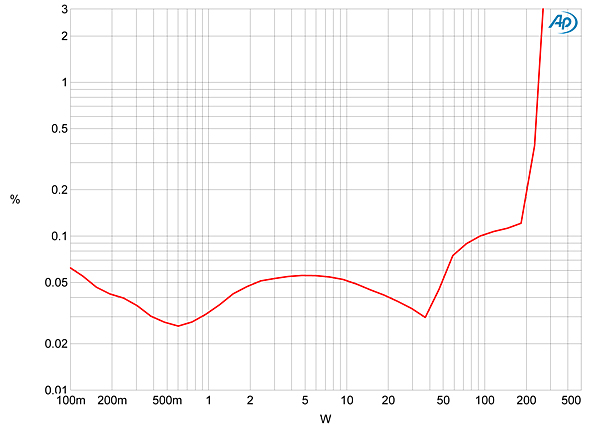
Fig.7 B.M.C. Amplifier C1, distortion (%) vs 1kHz continuous output power into 2 ohms.
This unhappiness with very low impedances can also be seen in fig.8, which plots the THD+N percentage against frequency at a level, 12.65V, equivalent to 20W into 8 ohms, where I could be sure that the reading wasn't being dominated by noise. The Amp C1 offers low THD into 8 ohms at this level, with the left channel (blue trace) being slightly more linear than the right (red). This is reversed into 4 ohms, with a somewhat higher level of THD (cyan and magenta traces). But with just the left channel driving 2 ohms (green trace), the C1 offers more than 10 times the THD that it does into 8 ohms.
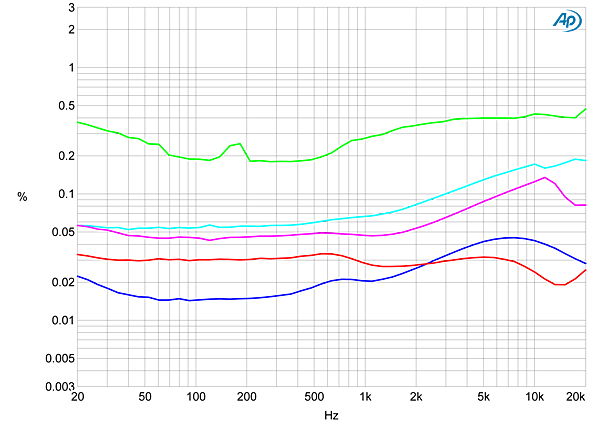
Fig.8 B.M.C. Amplifier C1, THD+N (%) vs frequency at 12.65V into: 8 ohms (left channel blue, right red), 4 ohms (left cyan, right magenta), 2 ohms (left green).
At low powers into high impedances, the distortion is strongly third-harmonic in nature (fig.9), which will be subjectively benign. But as the output current increases, some sharply defined discontinuities appear in the waveform of the spuriae (fig.10), which indicates the presence of the more subjectively disturbing high-order harmonics (fig.11). Although fig.8 indicates that the B.M.C.'s linearity at high frequencies is not significantly worse than at lower frequencies, driving an equal mix of 19 and 20kHz into 8 ohms at a level a couple of dB below visible waveform clipping into 8 ohms gave rise to many high-order products (fig.12), even though the difference tone at 1kHz lies at a respectably low 86dB (0.006%). However, dropping the power by 5dB significantly reduced the amount of intermodulation distortion (fig.13).
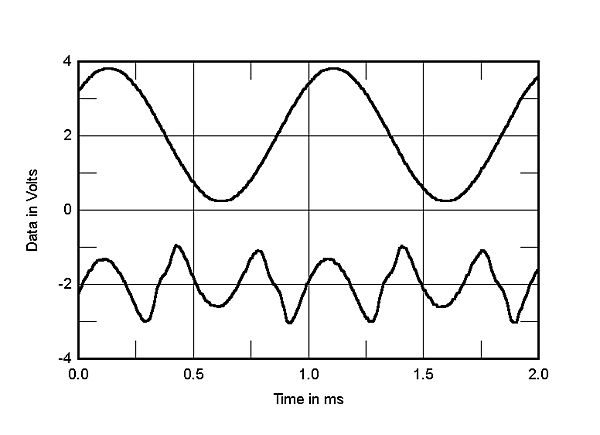
Fig.9 B.M.C. Amplifier C1, 1kHz waveform at 10W into 8 ohms (top), 0.021% THD+N; distortion and noise waveform with fundamental notched out (bottom, not to scale).
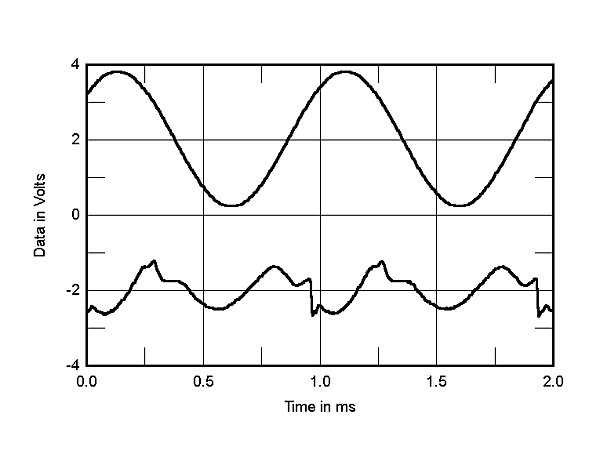
Fig.10 B.M.C. Amplifier C1, 1kHz waveform at 20W into 4 ohms (top), 0.0615% THD+N; distortion and noise waveform with fundamental notched out (bottom, not to scale).
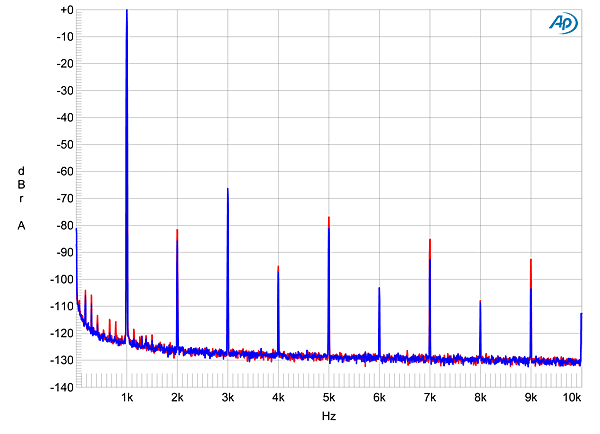
Fig.11 B.M.C. Amplifier C1, spectrum of 1kHz sinewave, DC–1kHz, at 50W into 8 ohms (linear frequency scale).
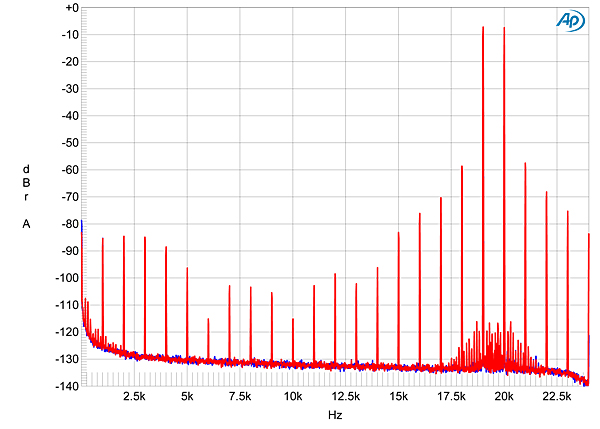
Fig.12 B.M.C. Amplifier C1, HF intermodulation spectrum, DC–24kHz, 19+20kHz at 100W peak into 8 ohms (linear frequency scale).
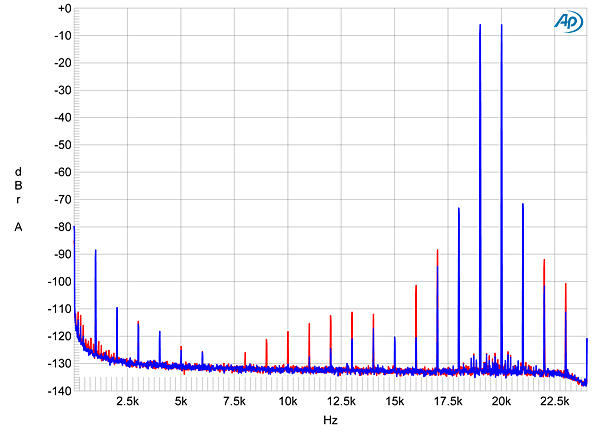
Fig.13 B.M.C. Amplifier C1, HF intermodulation spectrum, DC–24kHz, 19+20kHz at 30W peak into 8 ohms (linear frequency scale).
The measured performance of B.M.C. Audio's Amplifier C1 suggests that it offers a lot of power in a very attractive package for a relatively affordable price, but it really shouldn't be used with speakers that drop below 4 ohms; it is most comfortable with 8 ohm designs.—John Atkinson
|
| ||||||||||
- Log in or register to post comments


| Loudspeakers Amplification Digital Sources | Analog Sources Accessories Featured | Music Columns Retired Columns | Show Reports | Features Latest News Community | Resources Subscriptions |
 © 2024 Stereophile
AVTech Media Americas Inc., USA
All rights reserved

