| Columns Retired Columns & Blogs |
Bits is Bits? Page 3
In order to reduce the jitter sampling rate to a useful value, we take advantage of the following argument: In a practical interface receiver circuit the PLL will usually employ a loop filter with a break frequency of <20kHz. If we assume that the audio sampling rate is much greater than the PLL loop frequency, then the zero-crossing time to jitter-mapping operation can be performed by computing a running average of the zero-crossing times across two subframes. Thus, the jitter value associated with a pair of adjacent subframes can be written:
Footnote 6: Robert A. Finger, "Review of Frequencies and Levels for Digital Audio Performance Measurements," JAES, January/February 1986, Vol.34, pp.36-48.
Equation 8:
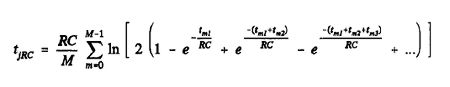
where M is the number of transitions averaged across two subframes, and tm1, tm2, etc., are the pulse widths prior to the mth transition.
Note how the effect of previous transitions upon the zero-crossing time at a given transition diminishes as we move further away from the transition. This allows a further reduction in jitter computation time, since we can limit the transition history taken into account without compromising accuracy.
Before examining the results of simulations that calculate the jitter on a band-limited interface, let's consider the idea of a jitter transfer function. Equation 8 indicates that the instantaneous jitter value associated with each interface signal frame depends upon the time between transitions (ie, pulse widths) during that frame. The pulse widths (either half or full cell width) in turn depend upon the position of ones and zeros in the transmitted interface signal.
Given that each audio sample value is represented by a unique bit pattern when biphase-mark-encoded by the interface transmitter, it is possible to calculate a jitter value for each audio sample value transmitted across the band-limited interface—and represent instantaneous interface jitter as a deterministic function of audio sample value.
Fig.10 shows such a mapping for 16-bit audio sample values in the -32,000 to 32,000 range, in steps of 100, for an RC time constant of 100ns. Here we have assumed that both channels carry the same audio value, and that the parity subcode bit is active; the 64 zero-crossing times at each cell boundary across the frame are calculated and then averaged to obtain a jitter value for the audio sample value. Fig.11 displays the same transfer function, but with an expanded horizontal scale over the -400 to 400 audio word range, in steps of one.
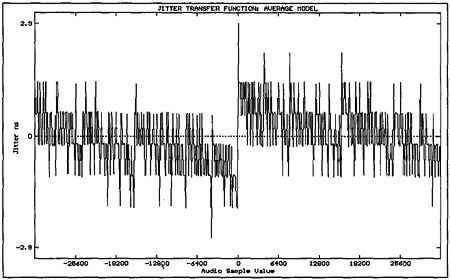
Fig.10 Jitter transfer function over audio range -32,000 to +32,000 in steps of 00 for interface time constant of 100ns.
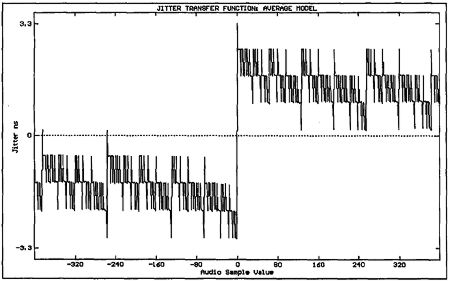
Fig.11 Expanded view of the central portion of fig.10.
The largest change in zero-crossing time occurs as the audio word value moves through zero; ie, changes sign. This is due to the twos-complement representation of the audio word within each subframe. The jitter exhibits a staircase-like transfer function as the audio word value moves away from zero; in fact, the zero-crossing time exhibits a strong dependence upon the difference between the number of zeros and ones in the 16-bit audio word. Fig.12 shows such a "Zero-One sum" across the -400 to 400 word range, with clear similarities to fig.11 (the sum extends to ±17 for the 16-bit audio word, because the parity subcode bit is active). With this approximation we can develop a simpler expression for interface jitter attributable to a given interface time constant.
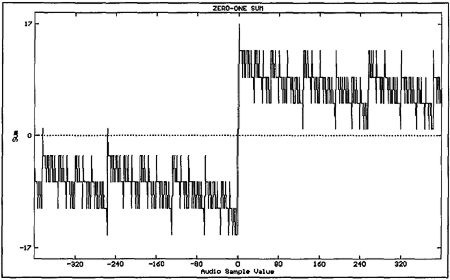
Fig.12 Zero-One sum for twos-complement-coded 16-bit audio word (compare to fig.11).
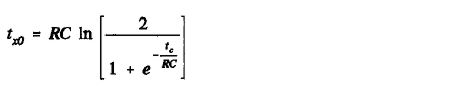
Consider the case when we transmit only zeros across the interface (even in the preamble): t1, t2, t3, etc., will all equal tc, and Equation 7 reduces to:
Equation 9:
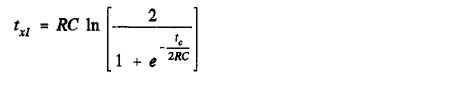
A similar expression occurs for the all-ones case, where t1, t2, t3, etc. = tc/2:
Equation 10:
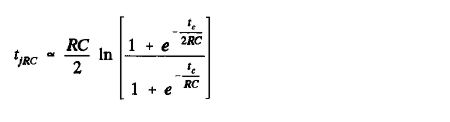
Subtracting Equation 9 from Equation 10 yields the approximate peak jitter due to a band-limited interface:
Equation 11:
This function is plotted in fig.13 for RC up to 400ns. We can use this approximation to scale the Zero-One sum shown in fig.12 to obtain the approximate jitter transfer function of fig.14. Note how similar this plot is to fig.11 (calculated using the average jitter model of Equation 8) in both scale and shape, indicating the fundamental dependence of interface jitter upon the Zero-One sum of the transmitted audio word.
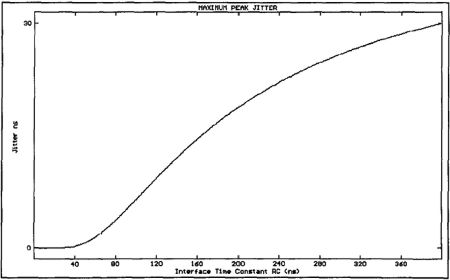
Fig.13 Maximum peak jitter plotted against interface RC time constant.
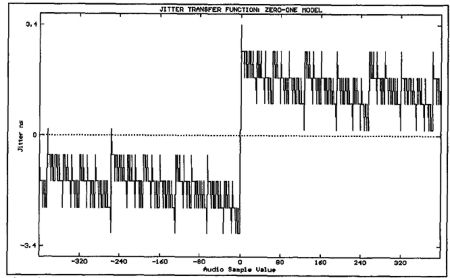
Fig.14 Jitter transfer function calculated using Zero-One model for RC = 100ns.
Having developed expressions for jitter based upon the bit pattern across adjacent interface subframes, we are now in a position to simulate a band-limited interface transmission and examine the resultant jitter signal for sinusoidal audio data. Fig.15 shows a dithered sinusoidal audio signal of 997Hz and peak amplitude 0dBFS, and the corresponding jitter signal for an interface time constant of 100ns. At first glance, the jitter signal appears to be noise-like, but when it is low-pass filtered (simulating a hypothetical PLL filter), the jitter is shown to be highly correlated with the audio (fig.16), despite an audio frequency that maximizes the number of PCM codes excited in the time domain (footnote 6). This is confirmed by computing the Fourier transform of the windowed and filtered jitter signal (fig.17), revealing strong spectral lines at the fundamental and third harmonic. (Throughout this article, the 0dB reference level in the jitter spectra is set to 1ns peak jitter.)
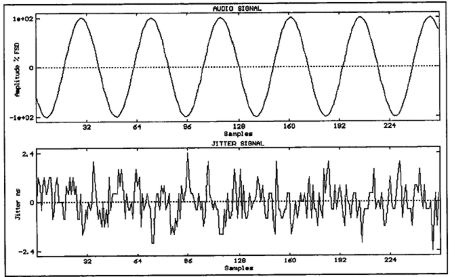
Fig.15 997Hz audio signal at 0dBFS (top) and corresponding jitter signal for interface time constant of 100ns and no PLL filtering (bottom).
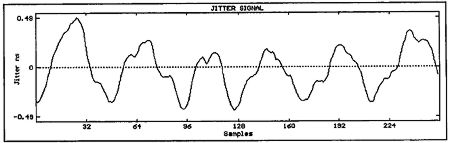
Fig.16 Jitter signal from fig.15 filtered using second-order Butterworth low-pass filter with 1kHz cutoff frequency.
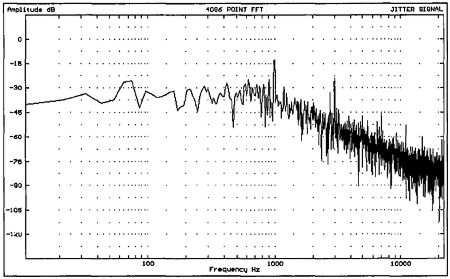
Fig.17 FFT-derived spectrum of fig.15 jitter signal.
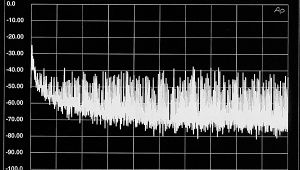
A similar jitter spectrum computed for a -70dB dithered 997Hz audio signal is shown in fig.18, where even stronger first and third harmonics are indicated. The increasing correlation between audio and jitter signals as the audio level is reduced is expected, since the audio signal spends a proportionately longer time in the crossover region of the jitter transfer function. Meitner and Gendron (footnote 7) have also found that the jitter spectrum in a decoded interface signal has a strong dependency upon audio level, but they account for this behavior in terms of power-supply artifacts or "logic-induced modulation." In truth, power-supply-related jitter in an interface decoder will resemble jitter due to band limitation, though the results presented here suggest that the band-limitation model compares well to jitter measured in practical circuits.
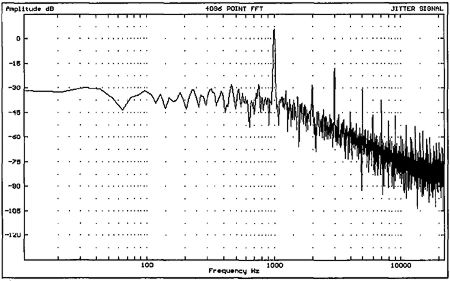
Fig.18 FFT-derived jitter spectrum associated with 997Hz sinewave at -70dBFS. Note stronger jitter components at 1kHz and 3kHz.
Footnote 6: Robert A. Finger, "Review of Frequencies and Levels for Digital Audio Performance Measurements," JAES, January/February 1986, Vol.34, pp.36-48.
Footnote 7: Ed Meitner and Robert Gendron, "Time Distortions Within Digital Audio Equipment Due to Integrated Circuit Logic Induced Modulation Products," presented at the 91st AES Convention, New York, October 1991, Preprint 3105.
NEXT: Page 4 »
|
| |||||||||
- Log in or register to post comments


| Loudspeakers Amplification Digital Sources | Analog Sources Accessories Featured | Music Columns Retired Columns | Show Reports | Features Latest News Community | Resources Subscriptions |
 © 2024 Stereophile
AVTech Media Americas Inc., USA
All rights reserved

