| Columns Retired Columns & Blogs |
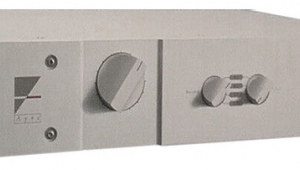
Ayre Acoustics K-1 preamplifier Measurements
Sidebar 3: Measurements
Unless otherwise noted, the measurements presented here are for balanced operation. The output impedance of the K-1 at its line output measured to specification at 556 ohms (279 ohms unbalanced) in the left channel and insignificantly higher in the right. The setting of the level control had virtually no effect on the output impedance. The line-level input impedance measured 21k ohms (9.8k ohms unbalanced), again with virtually no change with level setting or channel.
Phono input impedance measured 1108 ohms (this may be internally altered by the user). The output impedance at the tape output was 1975 ohms with a 50 ohm source impedance, 2151 ohms with a 600 ohm source. This is a fairly high value, but the small change with a change in source impedance indicates a buffered output. Volume-control tracking is excellent.
DC offset at the K-1's outputs was 11.5mV in the left channel and 0.9mV in the right, unbalanced. The DC on the two phases of the balanced output were identical but opposite in polarity in the left channel (good), but differed by 1mV in the right (inconsequential).
The preamp is inverting from its line inputs to its main outputs in the unbalanced mode; in the balanced mode, pin 2 is positive. From the phono inputs—which are balanced—to the unbalanced tape outputs the preamp is noninverting (we take all phono measurements at the tape outputs).
Line-stage voltage gain (CD input to line output) measured 16.3dB balanced and 10.3dB unbalanced. Phono gain measured 51.5dB, configured as delivered to me by WP for measurement (the gain is adjustable). S/N measured 92.5dB (unweighted) over a 22Hz-22kHz bandwidth, 81.5dB (unweighted) from 10Hz to 500kHz (the increase in noise from the prior figure was largely above 22kHz), and 94.8dB A-weighted (all ref. 1V) for the line stage. The same readings for the phono stage were, respectively, 73dB, 71dB, and 82dB.
The K-1's frequency response is shown in fig.1. The only item worthy of note here is the slight rise in the phono bass response below 100Hz—in any event, it is negligible at less than +0.5dB at 10Hz.
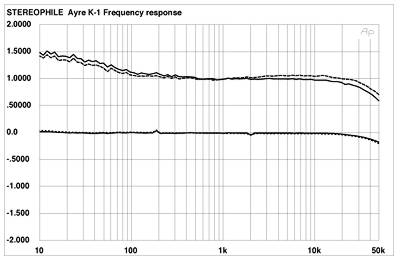
Fig.1 Ayre K-1, frequency response in balanced mode at 1V output into 100k ohms for phono stage (top) and line stage (bottom) (right channel dashed, 0.5dB/vertical div.).
The channel separation of the K-1 is shown in fig.2. There is the expected increase with frequency in the normal manner. While the shapes of the unbalanced line and phono crosstalk are a little unusual, the channel separation is more than acceptable—and exceptional in the balanced line mode.
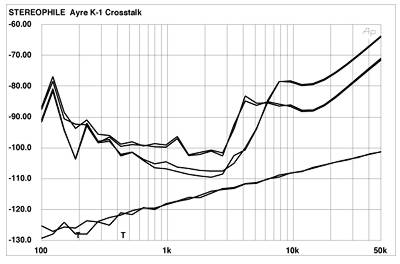
Fig.2 Ayre K-1, crosstalk (from bottom to top at 2kHz): L-R, phono; R-L, phono; L-R, line, unbalanced; R-L, line unbalanced; L-R, line, balanced; R-L, line balanced; (10dB/vertical div.).
Note that, to minimize the effect of noise, the crosstalk and THD+noise vs frequency measurements that follow were taken at inputs of 260mV (balanced line), 522mV (unbalanced line), and 4.5mV (phono). The THD+noise vs frequency for the K-1 is shown in fig.3. The only notable feature here is the sharp rise in phono distortion around 3.5kHz. This is apparently due to the high level chosen to minimize the effect of noise on the reading. Also shown in this figure is the THD+noise vs distortion for a more reasonable 1mV phono input. While the level is higher across much of the band due to the degraded S/N at this lower input, the 3.5kHz peak is eliminated.
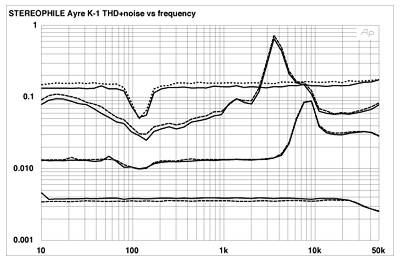
Fig.3 Ayre K-1, THD+noise vs frequency (from top to bottom at 1kHz): phono at 1mV/1kHz; phono at 4.25mV/1kHz; balanced line (right channel dashed).
Fig.4 shows the THD+noise percentage vs output voltage at 1kHz. The minimum points in the curves, just before the distortion increases rapidly, were the values chosen to run the measurements plotted in figs.2 and 3.
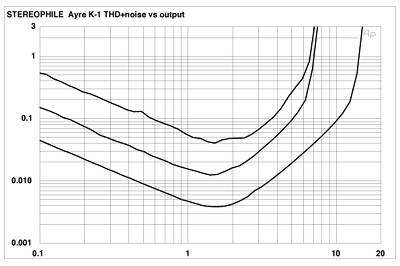
Fig.4 Ayre K-1, distortion (%) vs output voltage into 100k ohms (from bottom to top at 1V): line balanced, line unbalanced, phono.
The K-1's output spectrum reproducing a 50Hz input at a very high output level of 10V is shown in fig.5. Only the third harmonic, at 150Hz, is of any significance, and at -60dB (0.1%) it is of little concern—particularly since 10V output is about 8V above the level required to drive virtually any amp into clipping!
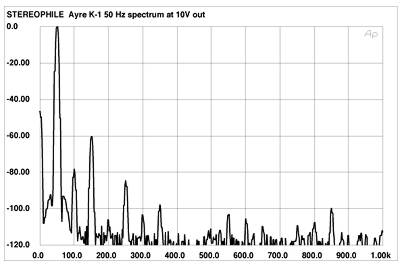
Fig.5 Ayre K-1, spectrum of 50Hz sinewave, DC-1kHz, at 10V into 100k ohms (linear frequency scale). Note that the third harmonic is the highest in level at -60dB (0.1%).
Finally, the phono overload margin of the K-1 was also very good; 1% THD+noise was reached at an input of 17.2mV at 1kHz, 161mV at 20kHz, and 1.63mV at 20Hz. The input signal used for these measurements was unequalized, and the variation with overload margin with frequency is due to the characteristics of the RIAA curve.
It would be difficult to seriously criticize the Ayre K-1's excellent test-bench performance.—Thomas J. Norton
NEXT: Paul Bolin, June 2002 »
|
|
| ||||||||||
- Log in or register to post comments


| Loudspeakers Amplification Digital Sources | Analog Sources Accessories Featured | Music Columns Retired Columns | Show Reports | Features Latest News Community | Resources Subscriptions |
 © 2024 Stereophile
AVTech Media Americas Inc., USA
All rights reserved

