| Columns Retired Columns & Blogs |
Audio Research SP20 preamplifier Measurements
Sidebar 3: Measurements
I used my top-of-the-line Audio Precision SYS2722 system (see www.ap.com and the January 2008 "As We See It") to measure the Audio Research SP20. With the SP20's volume control set to "103," the maximum gain for balanced line input and balanced output was basically to specification at 13.9dB. The volume control is implemented with close-tolerance Analog Devices AD5293 chips and the unity-gain setting was between "83" and "84." For single-ended line input/output, the maximum gain was 7.7dB and the unity-gain setting was "73." The gain at the Tape Out jacks was unity, as expected. The balanced output impedance at 20Hz was high at 3460 ohms, but dropped to 730 ohms at 1kHz and 20kHz, this a little higher than the specified 500 ohms. The unbalanced output impedances were half the balanced figures, and the SP20 preserved absolute polarity (ie, was non-inverting) with its Phase button set to Normal.
Looking first at the phono input, this offered a gain at 1kHz of 57.6dB, measured at the single-ended Tape Out jacks, which is appropriate for moving-coil cartridges. Set to "47k," the phono stage preserved absolute polarity and offered an input impedance of 48k ohms at 20Hz and 1kHz, and 32k ohms at 20kHz. Set to "100," the input impedance was 100.6 ohms at all audio frequencies. Overall, the RIAA equalization (fig.1) was extremely accurate, with only a slight (0.15dB) difference between the channels evident in the midrange. The unweighted signal/noise ratio, ref. 1kHz at 500µV (0.5mV) and taken with the inputs shorted, was a good 55dB left and 58dB right, these ratios respectively improving to 70.3 and 71.3dB when A-weighted.
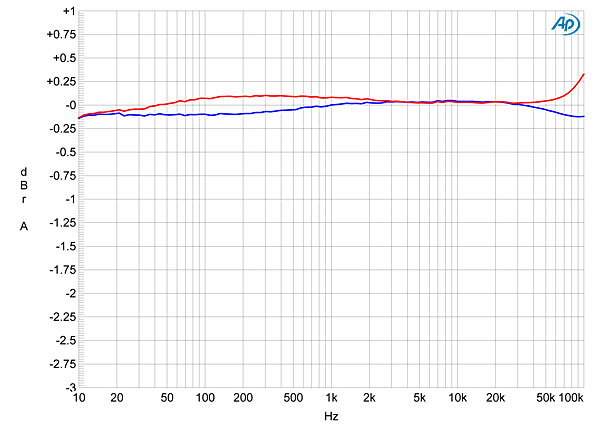
Fig.1 Audio Research SP20, phono input, response with RIAA correction (left channel blue, right red; 0.5dB/vertical div.).
The SP20's phono input offered superb overload margins at 30dB from 20Hz to 20kHz, and spectral analysis of the output with a 1kHz signal at 500µV (fig.2) revealed that the only harmonic visible above the noise floor was the second, at –96dB (0.0015%). Intermodulation distortion via the phono input was also very low (fig.3).
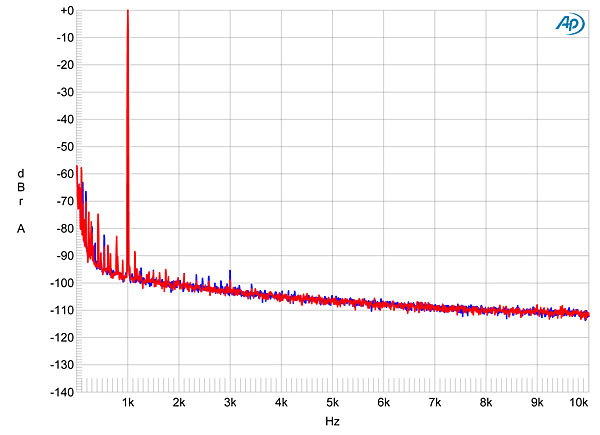
Fig.2 Audio Research SP20, phono input, spectrum of 1kHz sinewave, DC–10kHz, at 500µV input (left channel blue, right red; linear frequency scale).
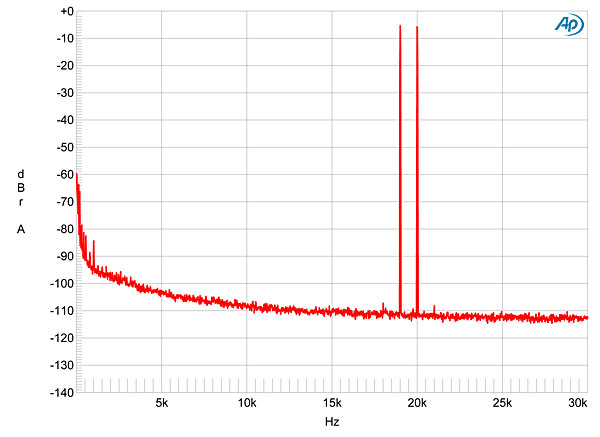
Fig.3 Audio Research SP20, phono input, spectrum of 19+20kHz sinewaves, DC–30kHz, at 5mV input (linear frequency scale).
Turning to the line inputs, these offered a balanced input impedance of 98k ohms at low and middle frequencies, dropping inconsequentially to 81k ohms at the top of the audioband. The unbalanced input impedances were half these, as expected. With the volume control set to its maximum, the frequency response into 100k ohms was perfectly flat within the audioband and superbly well matched between channels (fig.4, blue and red traces). With the high output impedance at low frequencies, it came as no surprise that the output rolled off below 200Hz into 600 ohms (fig.4, cyan, magenta), reaching –3dB at 58Hz. With the volume control set to "73" (green, gray), the line stage's ultrasonic response was more rolled off than with the control set to "103," but the output at 20kHz was still down by only a negligible 0.5dB.
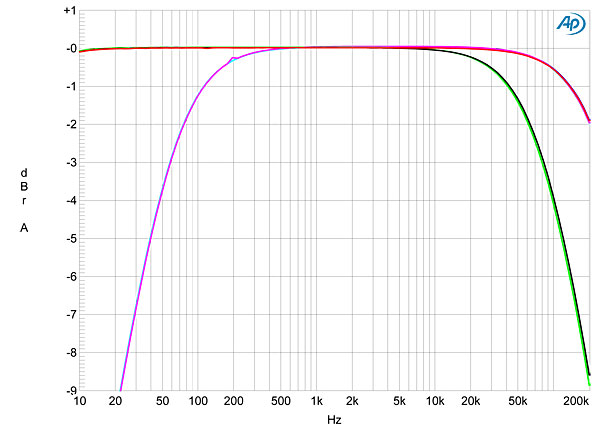
Fig.4 Audio Research SP20, balanced frequency response with volume control set to "103" at 1V into 100k ohms (left channel blue, right red) and 600 ohms (left cyan, magenta right), and with volume control set to "73" at 1V into 100k ohms (left green, right gray) (1dB/vertical div.).
Channel separation was excellent, at >110dB below 1kHz (not shown). The unweighted, wideband S/N ratio, taken with the inputs shorted but the volume control set to its maximum—very much the worst case—was 69.1dB left and 65.9dB right, both ref. 1V into 100k ohms. These figures improved by 9dB when the measurement bandwidth was restricted to the audioband, and by another 12dB when A-weighted. While some power-supply–related noise components are present at 60, 120, 180, and 300Hz, these are all at or below –110dB, hence negligible (fig.5).
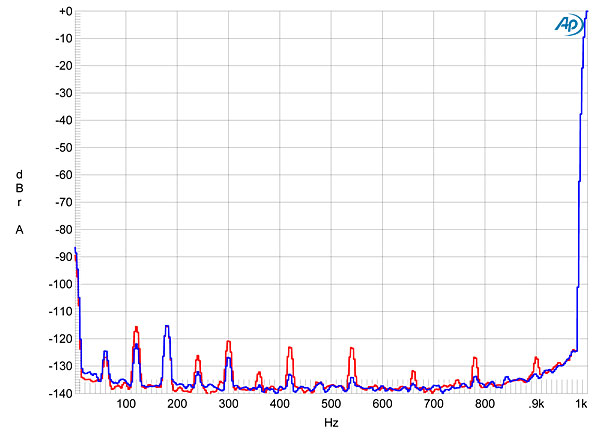
Fig.5 Audio Research SP20, spectrum of 1kHz sinewave, DC–1kHz, at 1V into 100k ohms (left channel blue, right red; linear frequency scale).
Operated in full balanced mode, the SP20 offered very low distortion. Fig.6 indicates that the actual distortion doesn't start to rise out of the noise floor until the SP20's rated output of 2V output into 100k ohms, which implies a sensibly implemented gain architecture. The THD rises in a linear manner with output voltage above that level until the signal clips at 18V or so. Plotted to the same scale as fig.6, fig.7 reveals that, operated in unbalanced mode, the SP20 both clips at 7.5V and doesn't offer as low distortion as in fully balanced mode. Loaded with 10k ohms, which is close to the lowest impedance the SP20 would see in practice, the THD+noise vs Voltage trace (fig.8) were similar to those in figs.6 and 7. However, asked to drive the punishing 600 ohm load, both balanced and unbalanced operation clipped at relatively low levels: 1.8V and 750mV, respectively. So even though the THD+N percentage varies very little with frequency and is low at the SP20's rated output, especially in balanced mode (fig.9), this preamplifier should not be used with power amplifiers that offer an input impedance of <10k ohms.
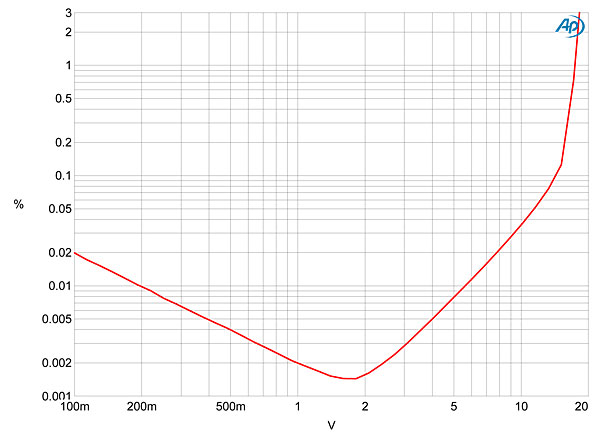
Fig.6 Audio Research SP20, balanced distortion (%) vs 1kHz output voltage into 100k ohms.
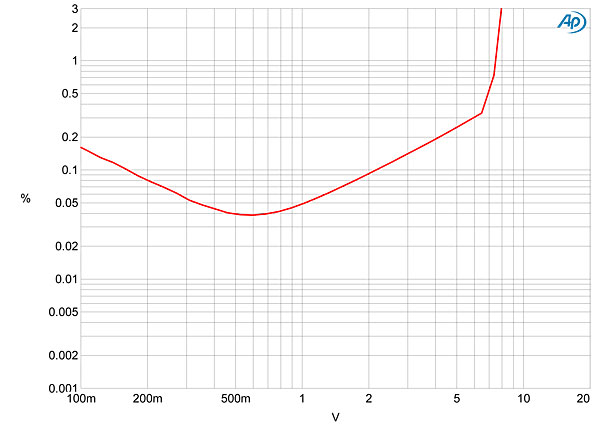
Fig.7 Audio Research SP20, unbalanced distortion (%) vs 1kHz output voltage into 100k ohms.
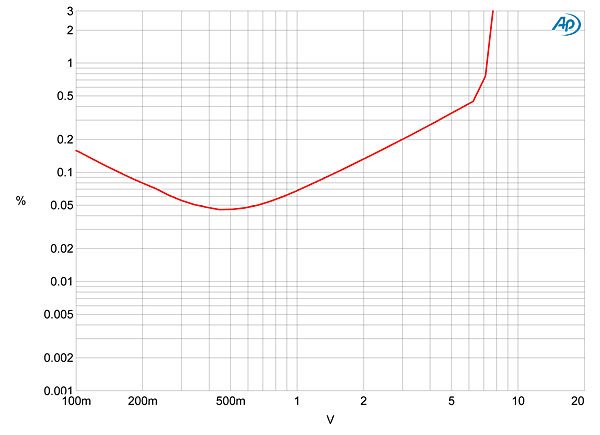
Fig.8 Audio Research SP20, unbalanced distortion (%) vs 1kHz output voltage into 10k ohms.
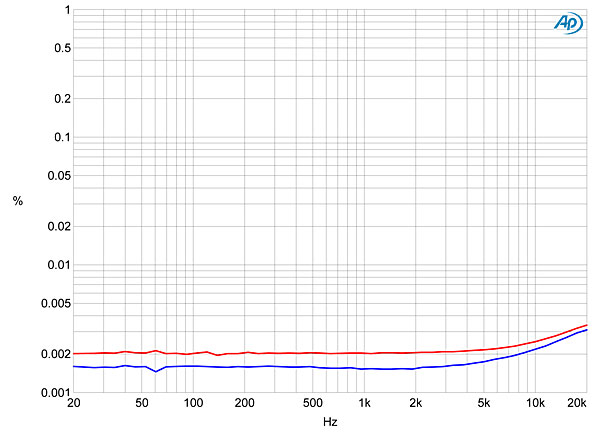
Fig.9 Audio Research SP20, balanced THD+N (%) vs frequency at 2V into: 100k ohms (left channel blue, right red).
Fig.10 reveals that the highest-level harmonic for balanced operation at 2V into 100k ohms is the third, at a very low –99dB (0.0011%), though the right channel (red trace) shows some second harmonic at almost the same level. The left channel's second harmonic (blue) lay at –112dB (0.00025%). Despite the lower rated output voltage, the second harmonic was the highest in level for unbalanced operation, at –67dB (0.04%) in both channels (fig.11), and the supply-related spuriae at 120 and 180Hz are both much higher than they were in balanced mode.
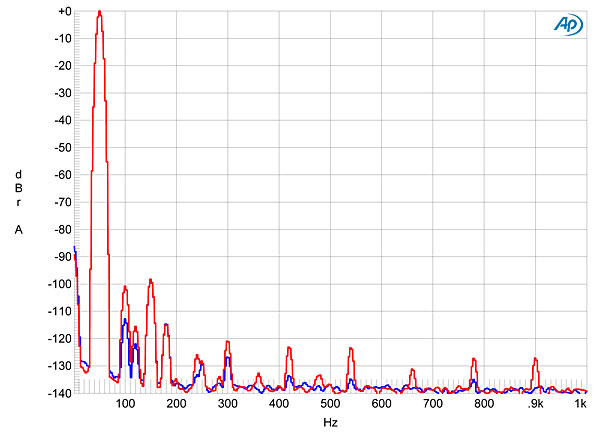
Fig.10 Audio Research SP20, balanced spectrum of 50Hz sinewave, DC–1kHz, at 2V into 100k ohms (left channel blue, right red; linear frequency scale).
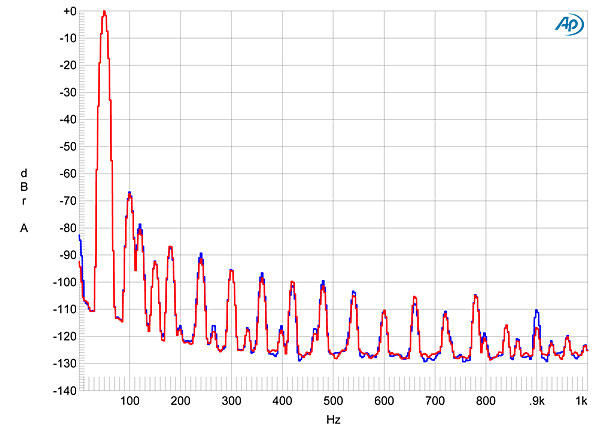
Fig.11 Audio Research SP20, unbalanced spectrum of 50Hz sinewave, DC–1kHz, at 1V into 100k ohms (left channel blue, right red; linear frequency scale).
Finally, intermodulation distortion was very low in balanced mode, at 2V into 100k ohms (fig.12). At the same level in unbalanced mode (fig.13), the second-order intermodulation product at 1kHz lay at –66dB (0.05%).
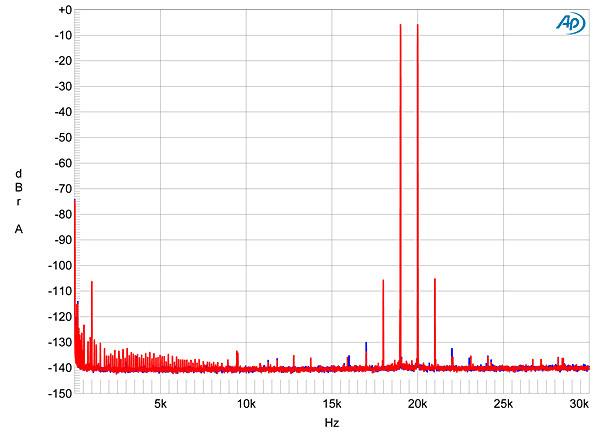
Fig.12 Audio Research SP20, balanced HF intermodulation spectrum, DC–30kHz, 19+20kHz at 2V peak into 100k ohms (left channel blue, right red; linear frequency scale).
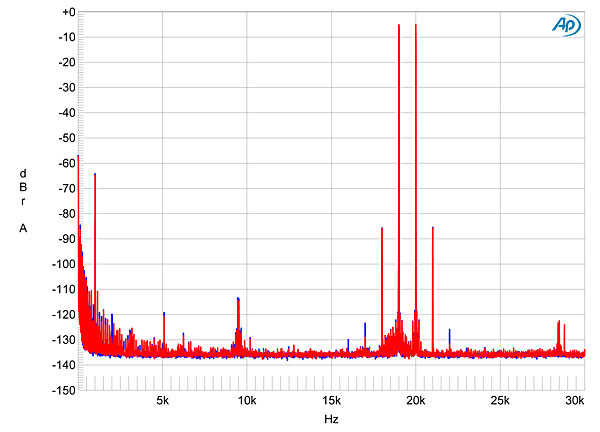
Fig.13 Audio Research SP20, unbalanced HF intermodulation spectrum, DC–30kHz, 19+20kHz at 2V peak into 100k ohms (left channel blue, right red; linear frequency scale).
Overall, the SP20's measured performance indicates a well-engineered, full-function preamplifier.—John Atkinson
|
| ||||||||||
- Log in or register to post comments


| Loudspeakers Amplification Digital Sources | Analog Sources Accessories Featured | Music Columns Retired Columns | Show Reports | Features Latest News Community | Resources Subscriptions |
 © 2024 Stereophile
AVTech Media Americas Inc., USA
All rights reserved

