Audio Research Reference CD9 CD player/DAC Measurements

Sidebar 3: Measurements

To measure the Audio Research Reference CD9, I used Stereophile's loan sample of the top-of-the-line Audio Precision SYS2722 system (see www.ap.com and the January 2008 "As We See It"); for some tests, I also used my vintage Audio Precision System One Dual Domain. To test the CD9's performance via USB, I used my MacBook Pro, running on battery power, with ARC's supplied USB2.0 driver (v.2.03.14), and played test-signal files with Bias Peak Pro, using Apple's AudioMIDI utility to ensure that the sample rate and bit depth were correctly set for each file.

Looking first at the CD9's behavior as a CD player, it offered superb error correction. Tested with the Pierre Verany Test CD, which has laser-cut gaps of varying lengths in its data spiral, the CD9 played track 33 (1.5mm gaps) with just one glitch, then occasionally glitched on tracks 35 (2mm gaps) and 36 (2.4mm gaps). It didn't have real trouble until the gaps were 3mm long!

The CD9's maximum output level at 1kHz was 5V from the balanced XLR jacks and half that from the single-ended RCAs, as expected. Both sets of outputs were non-inverting; ie, they preserved absolute polarity. (The XLRs are wired with pin 2 hot.) The output impedance at high and middle frequencies was 620 ohms from the balanced outputs, 307 ohms from the single-ended. At 20Hz, these figures respectively rose to 1400 and 604 ohms, which suggests that the CD9 should be used with preamplifiers having at least a 15k ohm input impedance.

The S/PDIF and AES/EBU inputs successfully locked to datastreams with sample rates of up to 192kHz. The TosLink input didn't work above 96kHz, which is normal for this type of connection. The USB connection worked with data having sample rates up to 192kHz, including 88.2 and 176.4kHz. Apple's USB Prober utility identified the CD9 as "AUDIO RESEARCH CORP DAC," but gave no information about the timing-synchronization protocol, this being handled by the "vendor-specific" driver program.

The CD9 offers four operational modes: Fast and Slow reconstruction filters, each with the option of being upsampled to 176.4kHz with 44.1 and 88.2kHz data, and to 192kHz with 48 and 96kHz data. Fig.1 shows the impulse response at 44.1kHz of the Fast filter and no upsampling. The time-symmetrical ringing reveals it to be a linear-phase FIR type, and wideband analysis of white noise sampled at 44.1kHz (a test suggested to me by MBL's Jürgen Reis) shows that it rolls off very quickly above 22kHz (fig.2, red trace). The blue trace in fig.2 is a similar analysis done while the CD9 played data representing a full-scale 19.1kHz tone. The Fast filter very effectively suppresses ultrasonic images of the tone, other than one at 69.1kHz (88,200–19,100Hz), and the second harmonic can be seen at –74dB (0.02%). The noise floor in this graph looks very dirty.

1013ARCfig01.jpg

Fig.1 Audio Research CD9, no upsampling, impulse response with Fast filter (4ms time window).

1013ARCfig02.jpg

Fig.2 Audio Research CD9, Fast filter, no upsampling, wideband spectrum of white noise at –4dBFS (left channel blue, right magenta) and 19.1kHz tone at 0dBFS (left cyan, right red), with data sampled at 44.1kHz (10dB/vertical div.).

Figs. 3 and 4 show the impulse response and the wideband spectral analysis of the CD9's Slow filter, again with upsampling disabled. The impulse response has just two well-damped cycles of ringing on each side of the pulse—something reminiscent of Wadia's DigiMaster reconstruction filter. (Audio Research and Wadia are now both owned by Fine Sounds from Italy, along with Sonus Faber and Sumiko.) However, while the rate of ultrasonic rolloff is much slower than the CD9's Fast filter, which means that the image of the 19.1kHz tone at 25kHz is suppressed by just 12dB (fig.4, blue trace), this filter is actually better behaved in its stopband than is Wadia's filter (see fig.2 here).

1013ARCfig03.jpg

Fig.3 Audio Research CD9, no upsampling, impulse response with Slow filter (4ms time window).

1013ARCfig04.jpg

Fig.4 Audio Research CD9, Slow filter, no upsampling, wideband spectrum of white noise at –4dBFS (left channel blue, right magenta) and 19.1kHz tone at 0dBFS (left cyan, right red), with data sampled at 44.1kHz (10dB/vertical div.).

To my surprise, while upsampling had no effect on the Fast filter's behavior in either the time or frequency domains, it had a drastic effect on the Slow filter's behavior. The well-behaved impulse response seen in fig.3 now resembled that in fig.1, and the filter's characteristic wideband spectral analysis in fig.4 was now identical to that of the Fast filter (fig.5). If you like the sound of the CD9's Slow filter with CDs, do not use upsampling.

1013ARCfig05.jpg

Fig.5 Audio Research CD9, Slow filter, upsampled to 176.4kHz, wideband spectrum of white noise at –4dBFS (left channel blue, right magenta) and 19.1kHz tone at 0dBFS (left cyan, right red), with data sampled at 44.1kHz (10dB/vertical div.).

The Fast filter's frequency response, with or without upsampling, rolls off by 0.5dB at 20kHz, with the higher sample rates continuing the smooth rolloff before dropping sharply at half of each sample rate (fig.6). Without upsampling, the response with CD data dropped off in the top octave, to reach –3dB at 20kHz (fig.7). At higher sample rates, the Slow filter offers an ultrasonic rolloff similar to the Fast filter's, but without the sharp cutoff just below half of each sample rate. Channel separation at 1kHz was excellent, at 110dB in both directions (fig.8), but this decreased to 84dB at 20kHz, due to the usual capacitive coupling between channels.

1013ARCfig06.jpg

Fig.6 Audio Research CD9, Fast filter, frequency response at –12dBFS into 100k ohms with data sampled at: 44.1kHz (left channel green, right gray), 96kHz (left cyan, right magenta), 192kHz (left blue, right red) (0.25dB/vertical div.).

1013ARCfig07.jpg

Fig.7 Audio Research CD9, Slow filter, frequency response at –12dBFS into 100k ohms with data sampled at: 44.1kHz (left channel green, right gray), 96kHz (left cyan, right magenta), 192kHz (left blue, right red) (0.25dB/vertical div.).

1013ARCfig08.jpg

Fig.8 Audio Research CD9, channel separation (L–R, blue, R–L, red; 5dB/vertical div.)

For consistency with my tests of digital products going back more than two decades, my first test of a DAC's resolution is to feed it dithered data representing a 1kHz tone at –90dBFS with 16- and 24-bit word lengths, and sweep a 1/3-octave bandpass filter from 20kHz down to 20Hz. The result is shown in fig.9, with the 16-bit spectrum the top pair of traces and the 24-bit spectrum the middle pair. The increase in bit depth drops the high-frequency noise floor by 12dB, implying resolution of around 18 bits, which is sufficient to allow the CD9 to resolve a dithered tone at –120dB, at least in the left channel (bottom solid trace). However, note the low-frequency peaks in these spectra, which are a little higher in the right channel (dotted traces) than the left. These are due to interference from the power supply, and can also be seen in an FFT-derived spectral analysis with the same data (fig.10). Because these spuriae are at 60Hz and its odd-order harmonics, that strongly suggests that they are due to magnetic interference from the power-supply transformer. The levels of all the spuriae are way too low to be audible; even so, they give rise to the dirty-looking noise floors in figs. 2, 4, and 5. Note the low-level spikes at 5.1 and 8kHz in fig.10, particularly in the left channel (blue trace). These may be idle tones of some kind, but are undoubtedly sonically innocuous.

1013ARCfig09.jpg

Fig.9 Audio Research CD9, 1/3-octave spectrum with noise and spuriae of dithered 1kHz tone at –90dBFS with 16-bit data (top) and 24-bit data (middle), and at –120dBFS with 24-bit data (bottom) (right channel dashed).

1013ARCfig10.jpg

Fig.10 Audio Research CD9, spectrum with noise and spuriae of dithered 1kHz tone at –90dBFS with: 16-bit data (left channel cyan, right magenta), 24-bit data (left blue, right red) (10dB/vertical div.).

The spectral spikes representing the tone at –90dB in these two graphs peak at exactly –90dB, implying very low linearity error. This was confirmed by a separate test (not shown). The CD9's reproduction of an undithered tone at precisely –90.31dBFS was excellent (fig.11), the three DC voltage levels described by the digital data being clearly resolved, though the low-frequency noise results in some offset in the two channels. Even at this very low signal level, the CD9 produced a well-formed sinewave with 24-bit data (fig.12).

1013ARCfig11.jpg

Fig.11 Audio Research CD9, waveform of undithered 1kHz sinewave at –90.31dBFS, 16-bit data (left channel blue, right red).

1013ARCfig12.jpg

Fig.12 Audio Research CD9, waveform of undithered 1kHz sinewave at –90.31dBFS, 24-bit data (left channel blue, right red).

The CD9 was uncomfortable driving very low impedances. But into an appropriately high impedance, the dominant harmonic distortion in the left channel was the third harmonic, at a low –89dB (0.003%, fig.13, blue trace); and, in the right channel, the second harmonic, at –73dB (0.02%, red trace). Though some higher-order harmonics can be seen, these are all well below –100dB (0.001%). The CD9 also did very well with the demanding high-frequency intermodulation test, although, as expected, the Fast filter (fig.14) was much more effective than the Slow filter (fig.15) at suppressing ultrasonic images of the 19 and 20kHz tones.

1013ARCfig13.jpg

Fig.13 Audio Research CD9, Fast filter, no upsampling, spectrum of 50Hz sinewave, DC–1kHz, at 0dBFS into 100k ohms (left channel blue, right red; linear frequency scale).

1013ARCfig14.jpg

Fig.14 Audio Research CD9, Fast filter, no upsampling, HF intermodulation spectrum, DC–30kHz, 19+20kHz at 0dBFS into 100k ohms (left channel blue, right red; linear frequency scale).

1013ARCfig15.jpg

Fig.15 Audio Research CD9, Slow filter, no upsampling, HF intermodulation spectrum, DC–30kHz, 19+20kHz at 0dBFS into 100k ohms (left channel blue, right red; linear frequency scale).

The power-supply–related spuriae made the spectrum of the CD9's output while it reproduced a 16-bit version of the J-Test signal from CD (fig.16) a little difficult to analyze. However, other than the three sideband pairs of unknown origin at ±1.6kHz, ±1.66kHz and ±1.71kHz, which were absent from otherwise similar spectra taken with 16-bit J-Test data fed to the S/PDIF and USB inputs, it looks as if the CD9 is not accentuating the odd-order harmonics of the LSB-level, low-frequency squarewave. Some spurious tones and a sideband pair at ±1.45kHz, again of unknown origin, can be seen with 24-bit external data (fig.17), particularly in the left channel (blue trace).

1013ARCfig16.jpg

Fig.16 Audio Research CD9, high-resolution jitter spectrum of analog output signal, 11.025kHz at –6dBFS, sampled at 44.1kHz with LSB toggled at 229Hz: 16-bit CD data (left channel blue, right red). Center frequency of trace, 11.025kHz; frequency range, ±3.5kHz.

1013ARCfig17.jpg

Fig.17 Audio Research CD9, high-resolution jitter spectrum of analog output signal, 11.025kHz at –6dBFS, sampled at 44.1kHz with LSB toggled at 229Hz: 24-bit data via USB from MacBook Pro (left channel blue, right red). Center frequency of trace, 11.025kHz; frequency range, ±3.5kHz.

Overall, Audio Research's Reference CD9 measures well, though I would steer clear of using its upsampling feature with the Slow filter.—John Atkinson

COMPANY INFO
Audio Research Corp.
3900 Annapolis Lane N.
Plymouth, MN 55447-5447
(763) 577-9700
ARTICLE CONTENTS

COMMENTS
volvic's picture

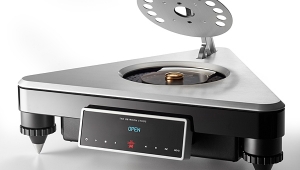
A very well laid out and thoughful review, enjoyed reading it.  The Audio Research has always been one of the best sounding CD players.  Heard it years ago with Verity Audio speakers and Audio Research amplification and still haven't heard anyting that resembles it for its 3-dimensionality.  A shame therefore that CD players seem to be on their way out, but what a great, last machine to own.  Then again this is the same language that was used in the 90's for vinyl so..........

commsysman's picture

This is ridiculous.

Put this $13000 player up against the $1200 OPPO BDP-105, and it will LOSE..

That is why they did not do the comparison, because it would show how obsolete ANY more expensive player is now. OPPO has blown away the competition.

I will bet that this thing doesn't even get a Class A+ rating in Recommended Components, which the the OPPO and AYRE players have had for some time now.

I got rid of my $6000 AYRE C5xe/MP becuse the OPPO BDP-95 sounds better.

I challenge you; MAKE THE COMPARISON.

It is absurd to do an article like this and not make the comparison; just sticking their heads in the sand,,,,OPPO...what OPPO???

DUHHHHHHHHHHHHHHHHH!!!!

Stephen Mejias's picture

I will bet that this thing doesn't even get a Class A+ rating in Recommended Components, which the the OPPO and AYRE players have had for some time now.

The Oppo BDP-105 is listed in Class A of our "Recommended Components," not Class A+. The Ayre C-5xeMP, however, is in Class A+.

The ratings for SACD and DVD-A players are based on how those players sound with their respective hi-rez media, not CD.

wozwoz's picture

Put it up against any medium price SACD player ... say $999 Marantz or Yamaha or even Oppo) that plays SACDs natively (pure DSD to analog converters) and this CD player will be toast, given a hi-rez recording.

tmsorosk's picture

I've heard the OPPO many times and in different systems , I consider it total junk , it should be sold with a pair of ear plugs . 

Fred Kaplan's picture

Some time ago, I did compare the Krell CD player (in the same league as Audio Research) with the Oppo, with an eye toward writing a piece about it. The Oppo is a fine player for the price, but it was a pale shadow of the Krell, in dynamics, tonal fidelity, bass and treble extension, imaging--in every which way. The difference was so great, it seemed senseless--unfair to Oppo--to compare them.

wozwoz's picture

This CD player seems outdated before birth... what kind of audiophile will pay $12000 for a CD player that cannot even play hi-rez SACDs?  Makes no sense. I'm not even sure that CD counts as an audiophile format anymore. In particular, if a recording starts life as a hi-rez recording (DSD or 24 bit / 96kHz), then the CD format necessarily requires throwing out about 3/4 of all the recorded information ... just to fit it onto a CD (which can only hold 700MB).

CD sales might be in decline, but hi-rez SACDs are flying off the shelves. According to the latest classical charts in the UK, 25 out of the top 100 current classical sellers are SACDs ... vastly in excess to the proportion of SACDs in the marketplace. Certainly tells you what people are buying today. 

hollowman's picture

6moons dived into this cdp a bit further:

======
The digital section is mechanically and electrically isolated from the analog stage. It mounts on a small separate PCB bolted to the rear and side panels. At the input we have a Burr Brown SRC4391 sample-rate converter followed by two Burr-Brown PCM1792 stereo DAc chips, one per channel. It is these DAC chips that allow built-in digital filter selection. Their stereo channels have been paralleled for mono. The USB input is handled differently. Its PCB plugs upside down into the main board for easy future upgrade. The circuit is based on a Cypress Semiconductor CY7C68013A. Next to it is a Xilinx Spartan FPGA along with two master clocks, one for each sample-rate family. The company literature claims that signal from all sources is reclocked to minimize jitter. I would bet it happens here. All electrical digital inputs as well as outputs feature impedance-matching transformers. The CD drive mounts to a large T-shaped profile machined from solid aluminium and decouples with springs.
============

hollowman's picture

6moons dived into this cdp a bit further:

======
The coaxial digital input comes from the same source and is found right next to three other inputs: AES/EBU, Toslink and USB. All accept 24/192. The USB input is of the asynchronous 2.0HS type.
============

X