Sidebar 3: Measurements
I used Stereophile's loan sample of the top-of-the-line Audio Precision SYS2722 system (see www.ap.com and the January 2008 "As We See It") to measure the Anthem Statement M1. Because Kalman Rubinson felt that the two sets of amplifiers he auditioned sounded different from each other, I measured one sample from the first set, serial no.147923, and one from the later set, no.148279. Unless stated otherwise, all measured data refer to this later sample.
I preconditioned each monoblock by running it at one-third its rated power into 8 ohms for 60 minutes. Thermally this is the worst case for an amplifier with a class-A/B output stage, but as an amplifier with a switching output stage is very efficient at turning power from the wall into voltage and current to drive the loudspeaker, this preconditioning shouldn't matter. Nevertheless, at the end of this period, the top plate inboard of the heatsinks, measured with an infrared thermometer, was hot, at 126.1°F (52.3°C), with the heatsinks slightly cooler, at 116.4°F (49.6°C). This shouldn't be an issue in regular use, but if the Anthem amplifiers are to be stacked, they'll need good ventilation.
The M1's voltage gain into 8 ohms was the same for its unbalanced and balanced inputs, at 28.7dB. The balanced input was set to "0dB" for this measurement; switching it to "–6dB" reduced the gain by exactly 6dB. Both inputs preserved absolute polarity (ie, were non-inverting), with the XLR wired with pin 2 hot. The input impedance was 20k ohms at low and middle frequencies from the XLR jack, and 9k ohms from the RCA. These figures dropped slightly but inconsequentially at 20kHz, to 17.5 and 7.8k ohms, respectively.
The amplifier's output impedance was very low at all audio frequencies, at 0.05 ohm including 6' of speaker cable. As a result, there was very little modification of its frequency response with our standard simulated loudspeaker (fig.1, gray trace), or reduction of its output level as the load impedance dropped. The older sample's frequency response was identical, being flat within the audioband but rolling off sharply above 20kHz, both samples reaching –3dB at 39kHz.
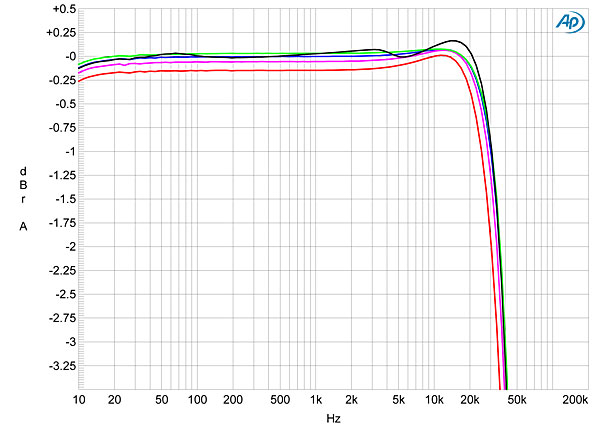

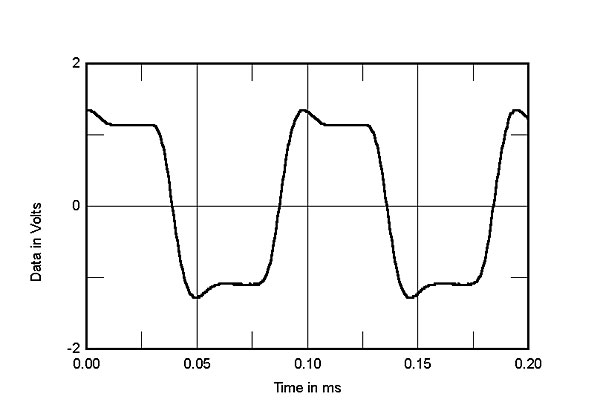

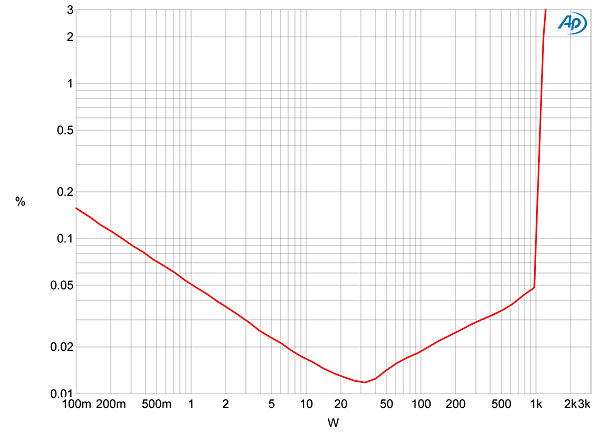
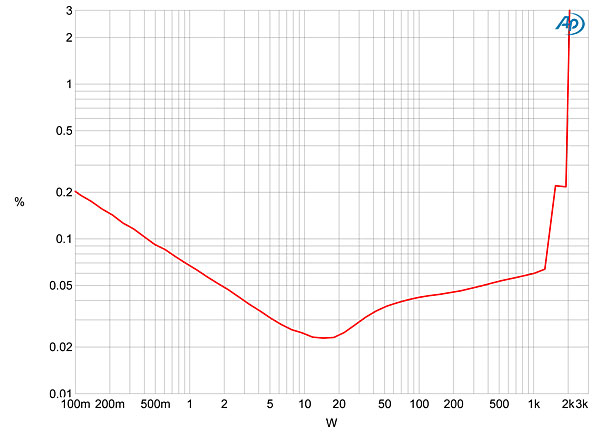
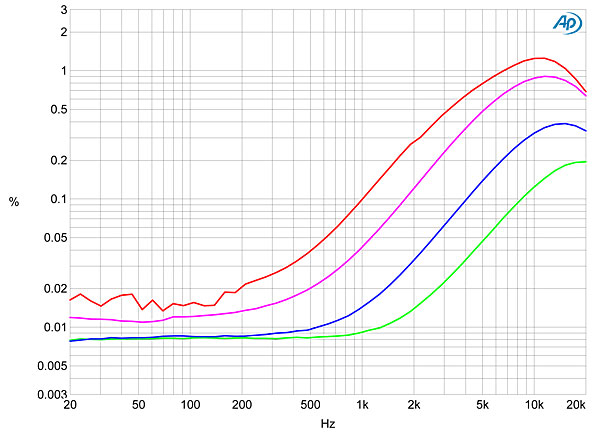


Fig.1 Anthem Statement M1, frequency response at 2.83V into: simulated loudspeaker load (gray), 16 ohms (green), 8 ohms (blue), 4 ohms (magenta), 2 ohms (red) (0.25dB/vertical div.).
Fig.2 shows the Anthem M1's output as it drove a 10kHz squarewave into 8 ohms. The waveform is obscured by a very high level of ultrasonic switching noise. With no signal present, this noise had a center frequency of 399kHz and, with a measurement bandwidth of 500kHz, a level of 851.5mV—the latter very much higher than the Mark Levinson No.53 reviewed elsewhere in this issue, which also has a switching output stage. (The older sample of the M1 had a slightly lower level of noise, at 802.4mV.) For all the following measurements, therefore, I placed an Audio Precision AUX-0025 passive low-pass filter between the dummy load and the Audio Precision analyzer's input. This filter has a maximum input level of ±200V peak, and rejects noise above 200kHz without affecting the measured performance. Fig.3 shows the M1's reproduction of a 10kHz squarewave into 8 ohms with the Audio Precision filter in-circuit. The ultrasonic switching noise has been eliminated to reveal a slow risetime, this associated with the amplifier's rolloff above 20kHz and a well-damped, half-cycle overshoot on the waveform's leading edges.
Fig.2 Anthem Statement M1, small-signal 10kHz squarewave into 8 ohms (no AP low-pass filter).
Fig.3 Anthem Statement M1, small-signal 10kHz squarewave into 8 ohms (with AP low-pass filter).
Without the AP filter, the Anthem's wideband, unweighted signal/noise ratio, ref. 2.83V into 8 ohms with the input shorted, was miserable: 10.4dB, due to the ultrasonic noise. With the AP low-pass filter this improved to 63.9dB, and restricting the measurement bandwidth to 22Hz–22kHz made a further improvement, to 75.5dB. A-weighting the measurement gave a ratio of 82.1dB. Anthem specifies the M1 as having an A-weighted S/N of 113dB ref. 1000W into 8 ohms. This level is 30dB higher than 2.83V, giving a measured A-weighted S/N of 112.1dB, which basically confirms the specification. Fig.4 shows a low-frequency spectral analysis of the M1's output, taken with the AP filter in-circuit while the amplifier reproduced a 1kHz tone at 100W into 8 ohms. The noise floor is very low, with no AC supply–related components visible.
Fig.4 Anthem Statement M1, spectrum of 1kHz sinewave, DC–1kHz, at 100W into 8 ohms (with AP low-pass filter, linear frequency scale).
I found the Anthem Statement M1 to be as much of a powerhouse as its specification suggests. Figs. 5 and 6 show how the THD+noise percentage in the amplifier's output changed with increasing power into 8 and 4 ohms, respectively. Defining clipping as the level at which the THD+N reaches 1%, the M1 clipped at the specified 1000W into 8 ohms (30dBW) and 2000W into 4 ohms (27dBW). However, as the output reached 2kW into 4 ohms (coincident with the discontinuity in the trace in fig.6), the amplifier began to emit a high level of mechanical hum, suggesting that the sustained output at this level was stressing the circuit. I didn't test the maximum output into 2 ohms, therefore, though it is fair to note that my test lab has a standard 120V supply, not the 240V that Anthem recommends.
Fig.5 Anthem Statement M1, distortion (%) vs 1kHz continuous output power into 8 ohms (with AP low-pass filter).
Fig.6 Anthem Statement M1, distortion (%) vs 1kHz continuous output power into 4 ohms (with AP low-pass filter).
The downward slopes of the traces below 15 and 30W, respectively, in figs. 5 and 6, indicate that the actual distortion in the M1's output is buried beneath the noise floor at output powers below these. The distortion rises slowly at higher powers until the point where the waveform actually starts to clip. I examined how the THD+N percentage changed with frequency at a level, 20V, equivalent to 50W into 8 ohms, where I could be sure I was looking at actual distortion rather than noise, therefore. The result, measured into loads ranging from 2 ohms (red trace) to 16 ohms (green trace), is shown in fig.7. The M1 offers very low distortion in the midrange, even into 2 ohms, but there is a dramatic increase in THD in the treble that is accentuated by the increase in output current demanded by the lower impedances. The bottom trace in fig.8 shows the waveform of the distortion at 100W into 8 ohms. The spiky shape indicates the presence of high-order harmonics, and you can see that the spikes coincide with the signal's zero-crossing points.
Fig.7 Anthem Statement M1, THD+N (%) vs frequency (with AP low-pass filter) at 20V into: 16 ohms (green), 8 ohms (blue), 4 ohms (magenta), 2 ohms (red).
Fig.8 Anthem Statement M1, 1kHz waveform at 100W into 8 ohms (with AP low-pass filter), 0.019% THD+N (top); distortion and noise waveform with fundamental notched out (bottom, not to scale).
At low powers into higher impedances (fig.9), the distortion comprises the subjectively innocuous second and third harmonics, with the third the highest in level at a very low –97dB (0.0014%). But at 100W into 8 ohms (fig.10), the level at which the waveform in fig.8 was taken, the third harmonic has risen to –77dB (0.014%). In itself this will be innocuous, but the third harmonic has been joined by a picket fence of higher-order harmonics. Yes, all of these lie at or below –90dB (0.003%), but their presence is not something I like to see.
Fig.9 Anthem Statement M1, spectrum of 1kHz sinewave, DC–10kHz, at 1W into 8 ohms (with AP low-pass filter, linear frequency scale).
Fig.10 Anthem Statement M1, spectrum of 1kHz sinewave, DC–10kHz, at 100W into 8 ohms (with AP low-pass filter, linear frequency scale).
The rise in THD at the top of the audioband resulted, as expected, in disappointing performance in the high-frequency intermodulation test. Fig.11 was taken at a power well below clipping into 4 ohms, but a large number of intermodulation products can be seen. While the second-order, difference product at 1kHz is respectably low in level, at –94dB (0.002%), the higher-order products at 18 and 21kHz almost reach –50dB (0.3%). Reducing the level to 100W and increasing the impedance to 8 ohms gave a spectrum (not shown) that was somewhat cleaner, though the 1kHz product dropped only slightly, to –97dB, and the 18 and 21kHz products were still above –60dB (0.1%).
Fig.11 Anthem Statement M1, HF intermodulation spectrum, DC–24kHz, 19+20kHz at 300W peak into 4 ohms (with AP low-pass filter, linear frequency scale).
The older sample's distortion performance was identical to that of the newer sample; there was nothing in the amplifier's measured performance that would suggest why KR preferred the high-frequency balance of the newer amplifiers. There is also nothing in the measurements that correlates with his feeling that the Statement M1's low frequencies sounded excessive, with poor definition. However, while this Anthem is extraordinarily powerful for its size, I am very suspicious of the effect of the high level of ultrasonic noise present in its output. Not only is the effect of this noise on a speaker unpredictable, especially with metal-dome tweeters and their ubiquitous high-Q ultrasonic diaphragm resonances, but to some extent the speaker cable will act as an antenna, radiating some of this noise as RF. The subjective effect of this behavior will depend on both the design of the cable and the susceptibility of the rest of the components in the system to this radiated energy. This will make the Anthem Statement M1's sound quality very system dependent. If you're attracted to the M1's virtues, be sure to listen to it with your own components and cables before pulling the trigger on the purchase.—John Atkinson