| Columns Retired Columns & Blogs |
Aerial Model 20T loudspeaker Measurements
Sidebar 3: Measurements
The Aerial Model 20T is around 3dB more sensitive than the norm, at an estimated 89.5dB(B)/2.83V/m. (The difference between this figure and the specified 90dB is within the margin of error for this measurement.) The speaker still needs to be used with an amplifier capable of good current delivery, however, as its impedance magnitude stays below 6 ohms through the midrange down to the midbass, and drops to minimum values of 3.35 ohms at 22Hz and 65Hz and 2.9 ohms at 236Hz (fig.1). There is also an amplifier-punishing combination of 4.4 ohms and a -48 degrees electrical phase angle at 17.5Hz, but, pipe-organ recordings aside, music has little energy in this region.

Fig.1 Aerial 20T, electrical impedance (solid) and phase (dashed) with switches set to "+1." (2 ohms/vertical div.)
This graph was plotted with both woofer and HF switches set to their righthand positions. With these set to their leftmost positions, the midrange minimum moved down in frequency slightly, while the impedance above 5kHz rose by 2-3 ohms (fig.2). (All other measurements were made with the two switches set to their central positions.) Note, by the way, the large difference between the average impedance in the midrange and that in the treble. With amplifiers having high source impedances—typical tube designs—the 20T's balance will tilt up in the highs.
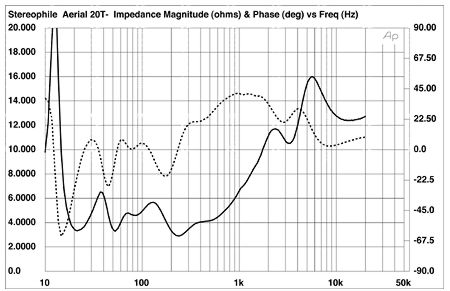
Fig.2 Aerial 20T, electrical impedance (solid) and phase (dashed) with switches set to "-1." (2 ohms/vertical div.)
The 20T's cabinets felt like stone to the knuckle-rap test. Examining the enclosure walls' vibrational behavior with a plastic-tape accelerometer revealed a very low level of flexure at 55Hz from the sides of the bass unit (fig.3), and a slightly higher level at 434Hz from the side of the midrange/HF head unit (fig.4). Neither will lead to audible coloration.

Fig.3 Aerial 20T, cumulative spectral-decay plot calculated from the output of an accelerometer fastened to the woofer cabinet's side panel. (MLS driving voltage to speaker, 7.55V; measurement bandwidth, 2kHz before crossover.)

Fig.4 Aerial 20T, cumulative spectral-decay plot calculated from the output of an accelerometer fastened to the midrange-treble cabinet's side panel. (MLS driving voltage to speaker, 7.55V; measurement bandwidth, 2kHz.)
The saddle centered at 22Hz in fig.1's magnitude trace suggests the tuning frequency of the downward-firing port. (The 20T was raised on its spiked feet for all measurements, giving a clearance of about 1.5" between the port opening and the floor.) However, the woofers' minimum-motion point can be seen in fig.5 (green trace) to lie slightly higher in frequency, at 25Hz. The port covers a broader bandpass than usual, and some higher-frequency activity is evident (red trace). However, this is very low in level and will be suppressed by the fact that the port opening is shielded from the listener by the body of the woofer enclosure. The output of the woofers rolls off above 260Hz with what appears to be a 24dB/octave slope, handing over to the midrange unit (blue trace). However, the woofers extend just a little too high in frequency to give the smoothest integration with the midrange unit, which is seen by the slight bump between 200Hz and 300Hz in the summed response of the LF drive-units and the port (black trace).

Fig.5 Aerial 20T, nearfield acoustic crossover, with responses of the midrange unit (blue), woofers (green), and port (red), along with their complex sum (black), taking into account acoustic phase and distance from the nominal farfield point.
This summed nearfield LF response is repeated in the left side of fig.6, spliced to the farfield response averaged across a 30 degrees horizontal window on the ribbon axis. The low-frequency hump might look alarming, but it is to a large extent a byproduct of the nearfield measurement technique, which assumes a hemispherical acoustic environment for the drive-units. Even so, the smaller the room in which the Aerial 20Ts are used, the greater the possibility of a little too much midbass in absolute terms.
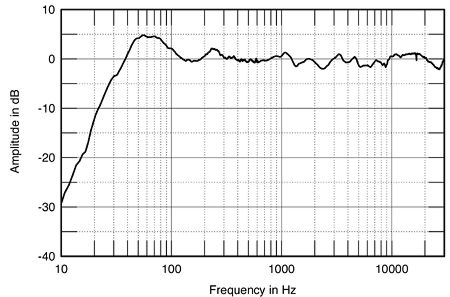
Fig.6 Aerial 20T, anechoic response on tweeter axis at 50", averaged across 30 degrees horizontal window and corrected for microphone response, with the complex sum of the port, woofer, and midrange nearfield responses plotted below 500Hz.
The midrange and treble response in fig.6 is superbly extended and flat, with the slightest hint of a laid-back presence region. However, as I always point out, a flat on-axis response correlates with a neutral perceived balance only if the speaker's dispersion—its off-axis behavior—is also even and well-controlled.
The 20T's horizontal dispersion is shown in fig.7. With the exception of a crossover-region suckout at extreme off-axis angles, the contour lines in the graph are uniformly spaced. This is excellent behavior, considering the disparate widths of the midrange and treble units, and contributes to the stable, well-defined stereo imaging I noted in my own auditioning of the 20Ts in Mikey's room.

Fig.7 Aerial 20T, lateral response family at 50", normalized to response on tweeter axis, from back to front: differences in response 90 degrees-5 degrees off-axis, reference response, differences in response 5 degrees-90 degrees off-axis.
However, that fairly long ribbon has very little vertical dispersion. As can be seen in fig.8, the plot of the 20T's vertical radiation pattern, the speaker's output falls off rapidly once the listener's ears move more than 5 degrees above or below the center of the ribbon. And if you stand up, not only do the high frequencies disappear above 7kHz, as noted by MF in his auditioning, but a suckout develops at the upper crossover frequency. This behavior will not be an issue in rooms of normal size, as long as the listener sits at an appropriate height; but in very large rooms, the 20T's limited vertical dispersion in the top octave and a half will render its balance too mellow.

Fig.8 Aerial 20T, vertical response family at 50", normalized to response on tweeter axis, from back to front: differences in response 15 degrees-5 degrees above axis, reference response, differences in response 5 degrees-10 degrees below axis.
In the time domain, the step response of the 20T's midrange-treble head unit (fig.9) indicates that both upper-frequency drive-units are connected with the same, positive acoustic polarity. Independent examination of the woofers' step responses (not shown) confirms that they are also connected in positive polarity. While the 20T is not time-coherent—the output of the ribbon arrives at the microphone before that of the midrange unit—each unit's step smoothly hands over to that of the next lower in frequency, confirming the excellent frequency-domain integration seen in fig.6.

Fig.9 Aerial 20T midrange-treble head unit, step response on tweeter axis at 50" (5ms time window, 30kHz bandwidth).
Finally, the 20T's cumulative spectral-decay plot (fig.10) is extremely clean throughout the region covered by the ribbon tweeter. (Ignore the dark ridge at 16.75kHz, which is due to interference from either my computer monitor or the closed-circuit TV camera-monitor combination I use to watch the speaker while it is being measured.) The very slight amount of delayed energy evident at 3.5kHz might be due to the high-order crossover filter. There is also a step at around 1.3kHz that just might—might—lead to a slight nasal coloration. But I noted no such coloration in my own auditioning, and neither did Mikey.
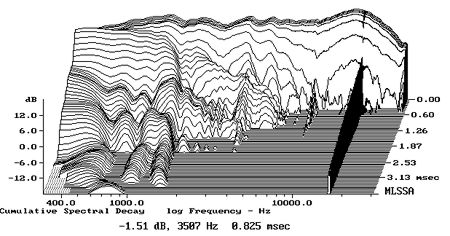
Fig.10 Aerial 20T, cumulative spectral-decay plot at 50" (0.15ms risetime).
Summing up these measurements is simple: Aerial's Model 20T is a superbly engineered speaker that amply fulfills the promise of its predecessors.—John Atkinson
|
|
| ||||||||||
- Log in or register to post comments


| Loudspeakers Amplification Digital Sources | Analog Sources Accessories Featured | Music Columns Retired Columns | Show Reports | Features Latest News Community | Resources Subscriptions |
 © 2024 Stereophile
AVTech Media Americas Inc., USA
All rights reserved

