| Columns Retired Columns & Blogs |
Acoustic Energy AE2 Signature loudspeaker Measurements
Sidebar 3: Measurements
Footnote 1: Because the altitude at Santa Fe reduces the sensitivity of all loudspeakers, I calculate sensitivity by comparing the measured, B-weighted level at 50" for a given voltage input, using a noise signal, with that obtained for a sample Rogers LS3/5A that I've measured both in Santa Fe and at sea level.
As I found with the single-ended Cary, the Acoustic Energy will play reasonably loud with only a few amplifier watts, reaching spls in the mid-90s without discomfort: I estimated its B-weighted sensitivity as 88dB/W/m (footnote 1), but this figure is compromised by the frequency response on the tweeter axis (see later). With an impedance magnitude that drops to 4.3 ohms in the lower midrange but stays above 6 ohms over almost all the rest of the audioband, the AE2 Signature is a relatively easy load for an amplifier to drive (fig.1). The double peak in the bass is typical of a reflex design, with the minimum at 43Hz indicating the tuning frequency of the tiny ports.

Fig.1 Acoustic Energy AE2 Signature, electrical impedance (solid) and phase (dashed) (2 ohms/vertical div.).
The major wrinkle in the traces at 25.5kHz corresponds to the metal tweeter's "oil-can" resonance, while the minor wrinkle just below 400Hz—not visible at the scale this graph is reproduced in the magazine—is probably due to a cabinet resonance of some kind. This was confirmed by sweeping a sinewave oscillator through this region while I was listening to the cabinet's vibrations with a stethoscope. Each of the cabinet walls could be heard to vibrate strongly between 350Hz and 370Hz, particularly the back panel. Though the musical note F# at the bottom of the treble staff lies in the center of this frequency region, and that note could be heard to sound a little sour with the semitone-spaced sinewave track on Test CD 3—the resonance "pulls" the pitch of the perceived sound a little off-key—no problem could be heard on music.
Fig.2 shows the individual responses of the two drive-units on the tweeter axis at a microphone distance of 50", together with the nearfield outputs of the woofers and ports (footnote 2). The actual crossover frequency can be seen to be around 4kHz, with an octave or so of overlap. The rolloff of both drivers is rather untidy, with acoustic slopes that appear to be a little less than 12dB/octave. Despite the use of a metal-cone woofer, there are no energy spikes in the woofer's treble output that could be laid at the door of cone-breakup modes.

Fig.2 Acoustic Energy AE2 Signature, acoustic crossover on tweeter axis at 50", corrected for microphone response, with nearfield woofer and port responses plotted below 300Hz and 2.5kHz, respectively.
The woofer's response shows the expected null at the approximate reflex port-tuning frequency—the back pressure from the resonance effectively prevents the woofer cone from moving, with all the output at this frequency consequently coming from the port—with the port output peaking in the same region. Notice, however, that the port output features sharp, strong peaks in the low treble, at 1.1kHz and 2.2kHz. These are presumably due to strong pipe resonances in the ports; I don't think it a coincidence that the far-field woofer output features a sharp notch at exactly the same frequency. While I could hear the 1.1kHz mode as a whistle coming from the ports with a pink-noise signal, particularly when the tweeter was disconnected, I was not aware of any problem playing music. Fortunately for Acoustic Energy, the ear is more tolerant of narrow notches than of narrow peaks.
But in fig.3, which shows how all these individual response sum on the tweeter axis in the far field (averaged across a 30° horizontal window), a large notch appears in the crossover frequency. Because the tweeter is to one side of the twin woofers, the design axis will also be to one side. Fig.4 shows the differences introduced by moving to the AE2's sides, with the tweeter-side changes plotted to the rear. Although it is hard to see from this graph, the crossover suckout deepens immediately off-axis on the tweeter side of the baffle, but fills on the woofer side. This can be seen from fig.5, which shows the response 20° off-axis on the woofer side. Other than the sharp notch at 1.1kHz, the balance is smooth, though the treble is slightly shelved-down on this axis. This is the reasoning behind Acoustic Energy's recommendation about putting the tweeters on the outside edges. The user can also fine-tune the overall high-frequency balance by experimenting with toe-in.

Fig.3 Acoustic Energy AE2 Signature, anechoic response on tweeter axis at 50", averaged across 30° horizontal window and corrected for microphone response, with complex sum of nearfield woofer and port responses plotted below 300Hz.

Fig.4 Acoustic Energy AE2 Signature, horizontal response family at 50", normalized to response on tweeter axis, from back to front: differences in response 90°–5° off-axis on tweeter side of baffle; reference response; differences in response 5°–90° off-axis on woofer side of baffle.

Fig.5 Acoustic Energy AE2 Signature, anechoic response on optimal axis at 50", 20° off-axis on woofer side of baffle, corrected for microphone response, with complex sum of nearfield woofer and port responses plotted below 300Hz.
To the left of figs.3 and 5 is shown the complex sum of the nearfield woofer and port outputs. As expected from my auditioning, it is a little overdamped but offers quite good LF extension, with a –6dB point of 45Hz. The high peak at 25.5kHz is due to the metal-dome tweeter's primary resonance. Though it looks alarming, its frequency is well above the limits of my hearing, at least. (In the mornings, my sensitivity extends up to 16.5kHz, which is about typical for someone my age, 47.)
Fig.6 shows the response changes introduced by moving above and below the AE2 Signature's recommended axis. Though the crossover notch fills in away from the tweeter axis, the upper midrange loses energy due to destructive interference between the two woofers. This reinforces Acoustic Energy's choice of the tweeter being the optimum vertical axis.

Fig.6 Acoustic Energy AE2 Signature, vertical response family at 50", normalized to response on tweeter axis, from back to front: differences in response 45°–5° above tweeter axis; reference response; differences in response 5°–45° below tweeter axis.
Once I had the AE2s optimally set-up, I found their perceived tonal balance to be neutral. This is confirmed by fig.7, which shows the speakers' spatially averaged response in my room (footnote 3). The balance is pretty flat, with just a slightly forward midrange evident. If you ignore the peak at 63Hz, which is a residual room mode that has not been removed by the spatial averaging, the bass region can be seen to be actually shelved-down slightly, which correlates with my feeling that the bass region sounded a little lean. But note that reinforcement from the room means that useful bass is present down to the 32Hz band. Below that frequency, however, the use of a reflex alignment means that the speaker's output drops like a stone.
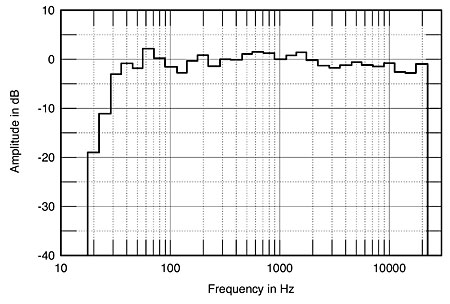
Fig.7 Acoustic Energy AE2 Signature, spatially averaged, 1/3-octave response in JA's room.
In the time domain, the AE2's impulse response (not shown) is overlaid with ultrasonic ringing from the tweeter, while the step response (fig.8) reveals that the tweeter is connected with negative polarity, the woofers with positive. Because the drive-units are not vertically aligned, the opposing-polarity connection aims the main response lobe to the woofer side of the baffle. Reversing the tweeter polarity still gave a notch on the tweeter axis (though lower in frequency), but now the main response lobe was off-axis on the tweeter side.
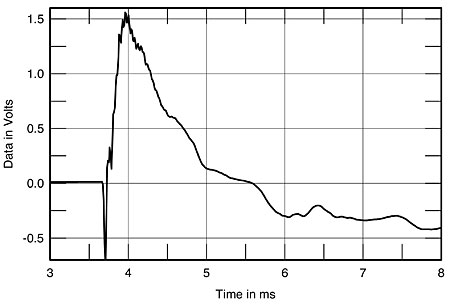
Fig.8 Acoustic Energy AE2 Signature, step response on tweeter axis at 50" (5ms time window, 30kHz bandwidth).
Finally, the Acoustic Energy's cumulative spectral-decay, or waterfall, plot (fig.9) showed an initially clean decay, but with then some hash developing in the mid-treble, this possibly due to woofer-cone modes. Note that the notch at 1.1kHz is associated with the release of delayed energy at the same frequency.—John Atkinson

Fig.9 Acoustic Energy AE2 Signature, cumulative spectral-decay plot at 50" (0.15ms risetime).
Footnote 1: Because the altitude at Santa Fe reduces the sensitivity of all loudspeakers, I calculate sensitivity by comparing the measured, B-weighted level at 50" for a given voltage input, using a noise signal, with that obtained for a sample Rogers LS3/5A that I've measured both in Santa Fe and at sea level.
Footnote 2: Other than impedance, all acoustic measurements were made with the DRA Labs MLSSA system and a calibrated B&K (DPA) 4006 microphone. To minimize reflections from the test setup, the measuring microphone is flush-mounted inside the end of a long tube. Reflections of the speaker's sound from the mike stand and its hardware will be sufficiently delayed not to affect the measurement.
Footnote 3: For my in-room spectral analyses I average six measurements at each of 10 separate microphone positions for left and right speakers individually, giving a total of 120 original spectra. These are then averaged to give a curve that, in my room, has proved to give a good correlation with a loudspeaker's perceived balance. I use an Audio Control Industrial SA-3050A spectrum analyzer with its own microphone, which acts as a check on the MLSSA measurements made with the B&K mike. I also used the Goldline DSP-30 automated spectrum analyzer.
|
| ||||||||||
- Log in or register to post comments


| Loudspeakers Amplification Digital Sources | Analog Sources Accessories Featured | Music Columns Retired Columns | Show Reports | Features Latest News Community | Resources Subscriptions |
 © 2024 Stereophile
AVTech Media Americas Inc., USA
All rights reserved

