| Columns Retired Columns & Blogs |
Accuphase M-2000 monoblock power amplifier Measurements
Sidebar 3: Measurements
A full set of measurements was taken in the Accuphase M-2000's balanced mode, with selected measurements repeated in the unbalanced configuration. Unless otherwise noted, the measurements presented here are of balanced operation.
Following the M-2000's 1/3-power, one-hour preconditioning test, its heatsinks were merely warm. The input impedance measured 49.4k ohms (24.4k ohms unbalanced). The output impedance was a extremely low 0.035 ohm at 1kHz, increasing to a measured maximum of 0.038 ohm at 20Hz into an 8 ohm load, and 0.063 ohm at 20kHz into 4 ohms. Such low values indicate that the amplifier's frequency response into actual loudspeaker impedances should be the same.
The amplifier's voltage gain into 8 ohms measured 28dB as specified, balanced and unbalanced. DC offset fluctuated between 0.0 and 0.1mV—essentially unmeasurable. Signal to noise (ref. 1W into 8 ohms) measured 95.2dB over a 22Hz–22kHz bandwidth and 88.1dB over 10Hz–500kHz, both unweighted, and 97.4dB A-weighted. The corresponding unbalanced S/N measurements were 93.7dB, 87.5dB, and 95.6dB.
The M-2000 is noninverting from its unbalanced input. In balanced mode, pin 3 is positive. (The normal AES convention is pin 2 positive, but many Japanese products, and a few others, choose to make pin 3 positive. If the rest of your components are pin-3 positive, the signal fed to the speakers will not be inverted. If only the M-2000 is pin-3 positive, the output will be inverted.)
Fig.1 shows the M-2000's frequency response. It is very flat across most of the audible range, with an audibly insignificant rise of less than 0.2dB from 20kHz to 30kHz. The unbalanced response (not shown) was essentially identical. The small-signal 10kHz squarewave response in fig.2 is respectable. There is a slight overshoot at the leading edge, but no ringing, and a good risetime. This overshoot is also visible in the otherwise excellent 1kHz squarewave performance (not shown).
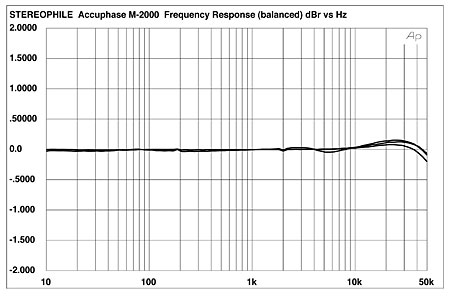
Fig.1 Accuphase M-2000, balanced, frequency response at (from top to bottom at 6kHz): 2W into 4 ohms, 1W into 8 ohms, and 2.828V into simulated loudspeaker load, (0.5dB/vertical div.).

Fig.2 Accuphase M-2000, small-signal 10kHz squarewave into 8 ohms.
The THD+noise vs frequency result (fig.3) shows exceptionally low distortion below 10kHz, with some increase at higher frequencies. The only exception is into a 2 ohm load, where the distortion rises significantly at high frequencies, if still to only slightly above 0.1%—arguably, an audibly insignificant level. To get a recognizable distortion waveform out of the noise, I had to use a higher output level than normal. Fig.4, at 20W into 2 ohms, indicates that the distortion is predominantly third-order, though higher-order components are also present. The result is similar at 10W into 4 ohms (not shown), though the noise is more evident due to the lower level of the distortion. At 20W into 8 ohms (not shown) the predominant harmonic becomes second-order, with some evidence of higher-order harmonics plus noise.

Fig.3 Accuphase M-2000, THD+noise (%) vs frequency at (from top to bottom at 6kHz): 4W into 2 ohms, balanced; 2W into 4 ohms, balanced; 2W into 4 ohms, unbalanced; 2.83V into simulated loudspeaker load, balanced; 1W into 8 ohms, unbalanced; and 1W into 8 ohms, balanced.

Fig.4 Accuphase M-2000, 1kHz waveform at 20W into 2 ohms (top), distortion and noise waveform with fundamental notched out (bottom, not to scale).
The M-2000's output spectrum to a 50Hz input at 335W output into 4 ohms is shown in fig.5. This is a superb result; all of the distortion components are well below –90dB (0.003%). Measuring the intermodulation products resulting from an input signal consisting of an equal combination of 19kHz and 20kHz (fig.6), also at 335W into 4 ohms, proved an exercise of equal frustration: All of the artifacts are at or below –80dB (0.01%). The same is true for the measurement taken at 168W into 8 ohms (not shown).

Fig.5 Accuphase M-2000, spectrum of 50Hz sinewave, DC–1kHz, at 335W into 4 ohms (linear frequency scale).

Fig.6 Accuphase M-2000, HF intermodulation spectrum, DC–22kHz, 19+20kHz at 335W into 4 ohms (linear frequency scale).
The 1kHz, THD+noise percentage vs power curves for the M-2000 are shown in fig.7. Because of the amplifier's extremely high power output and the limitations of our test load, no attempt was made to measure the M-2000's continuous power into 2 ohms. The amplifier clipped (1% THD+noise at 1kHz) at 439W (26.4dBW) into 8 ohms (114V line), and at 774W (25.9dBW) into 4 ohms (112V line).

Fig.7 Accuphase M-2000, distortion (%) vs continuous output power into (from bottom to top) 8 ohms and 4 ohms.
John Atkinson used the Miller Amplifier Profiler to examine the M-200's output power on a slow-duty-cycle 1kHz toneburst, which is more like a typical music waveform. The results are shown in fig.8. Specified at a continuous 250W into 8 ohms, the Accuphase actually didn't clip until 524W (black trace), with 1007W available into 4 ohms (red), 1938W (blue), and 3602W (green)! The distortion level remained low into all these loads until reaching the distortion "knee." (Note that these figures are a little higher than implied by fig.3; this is because JA had to use a line preamplifier to get enough signal to drive the M-2000 fully into clip.)

Fig.8 Accuphase M-2000, distortion (%) vs 1kHz burst output power into 8 ohms (black trace), 4 ohms (red), 2 ohms (blue), and 1 ohm (green).
The Accuphase M-2000's test-bench measurements were outstanding, the only possible exceptions being the slight squarewave overshoot and the distortion into a 2 ohm load—and those stand out not because they're particularly bad, but only because of the exceptional performance surrounding them in all other respects.—Thomas J. Norton
|
| ||||||||||
- Log in or register to post comments


| Loudspeakers Amplification Digital Sources | Analog Sources Accessories Featured | Music Columns Retired Columns | Show Reports | Features Latest News Community | Resources Subscriptions |
 © 2024 Stereophile
AVTech Media Americas Inc., USA
All rights reserved

